Create alerts in nav-logs (OpenSearch Dashboards) 
Not supported by Nais
This logging solution is not supported by Nais. See Loki for the new default logging solution.
This guide will help you create alerts based on your application logs in nav-logs (OpenSearch Dashboards).
Alerting in OpenSearch consists of two main components: notification channels (where alerts are sent) and monitors (what triggers the alerts). You must create a notification channel before you can create a monitor.
Prerequisites 
- You have enabled logging to nav-logs for your application
- You have access to nav-logs
- You have a Slack webhook URL ready (see Step 1 below)
Step 1: Create a notification channel 
Before you can receive alerts, you need to create a notification channel. This defines where your alerts will be sent.
Sensitive information
The Slack webhook URL is sensitive and should be kept secure. Only paste it into the OpenSearch notification channel configuration.
Access notification channels 
- Navigate to logs.az.nav.no
- Open the menu and navigate to Notifications → Channels
- Or go directly to the Channels page
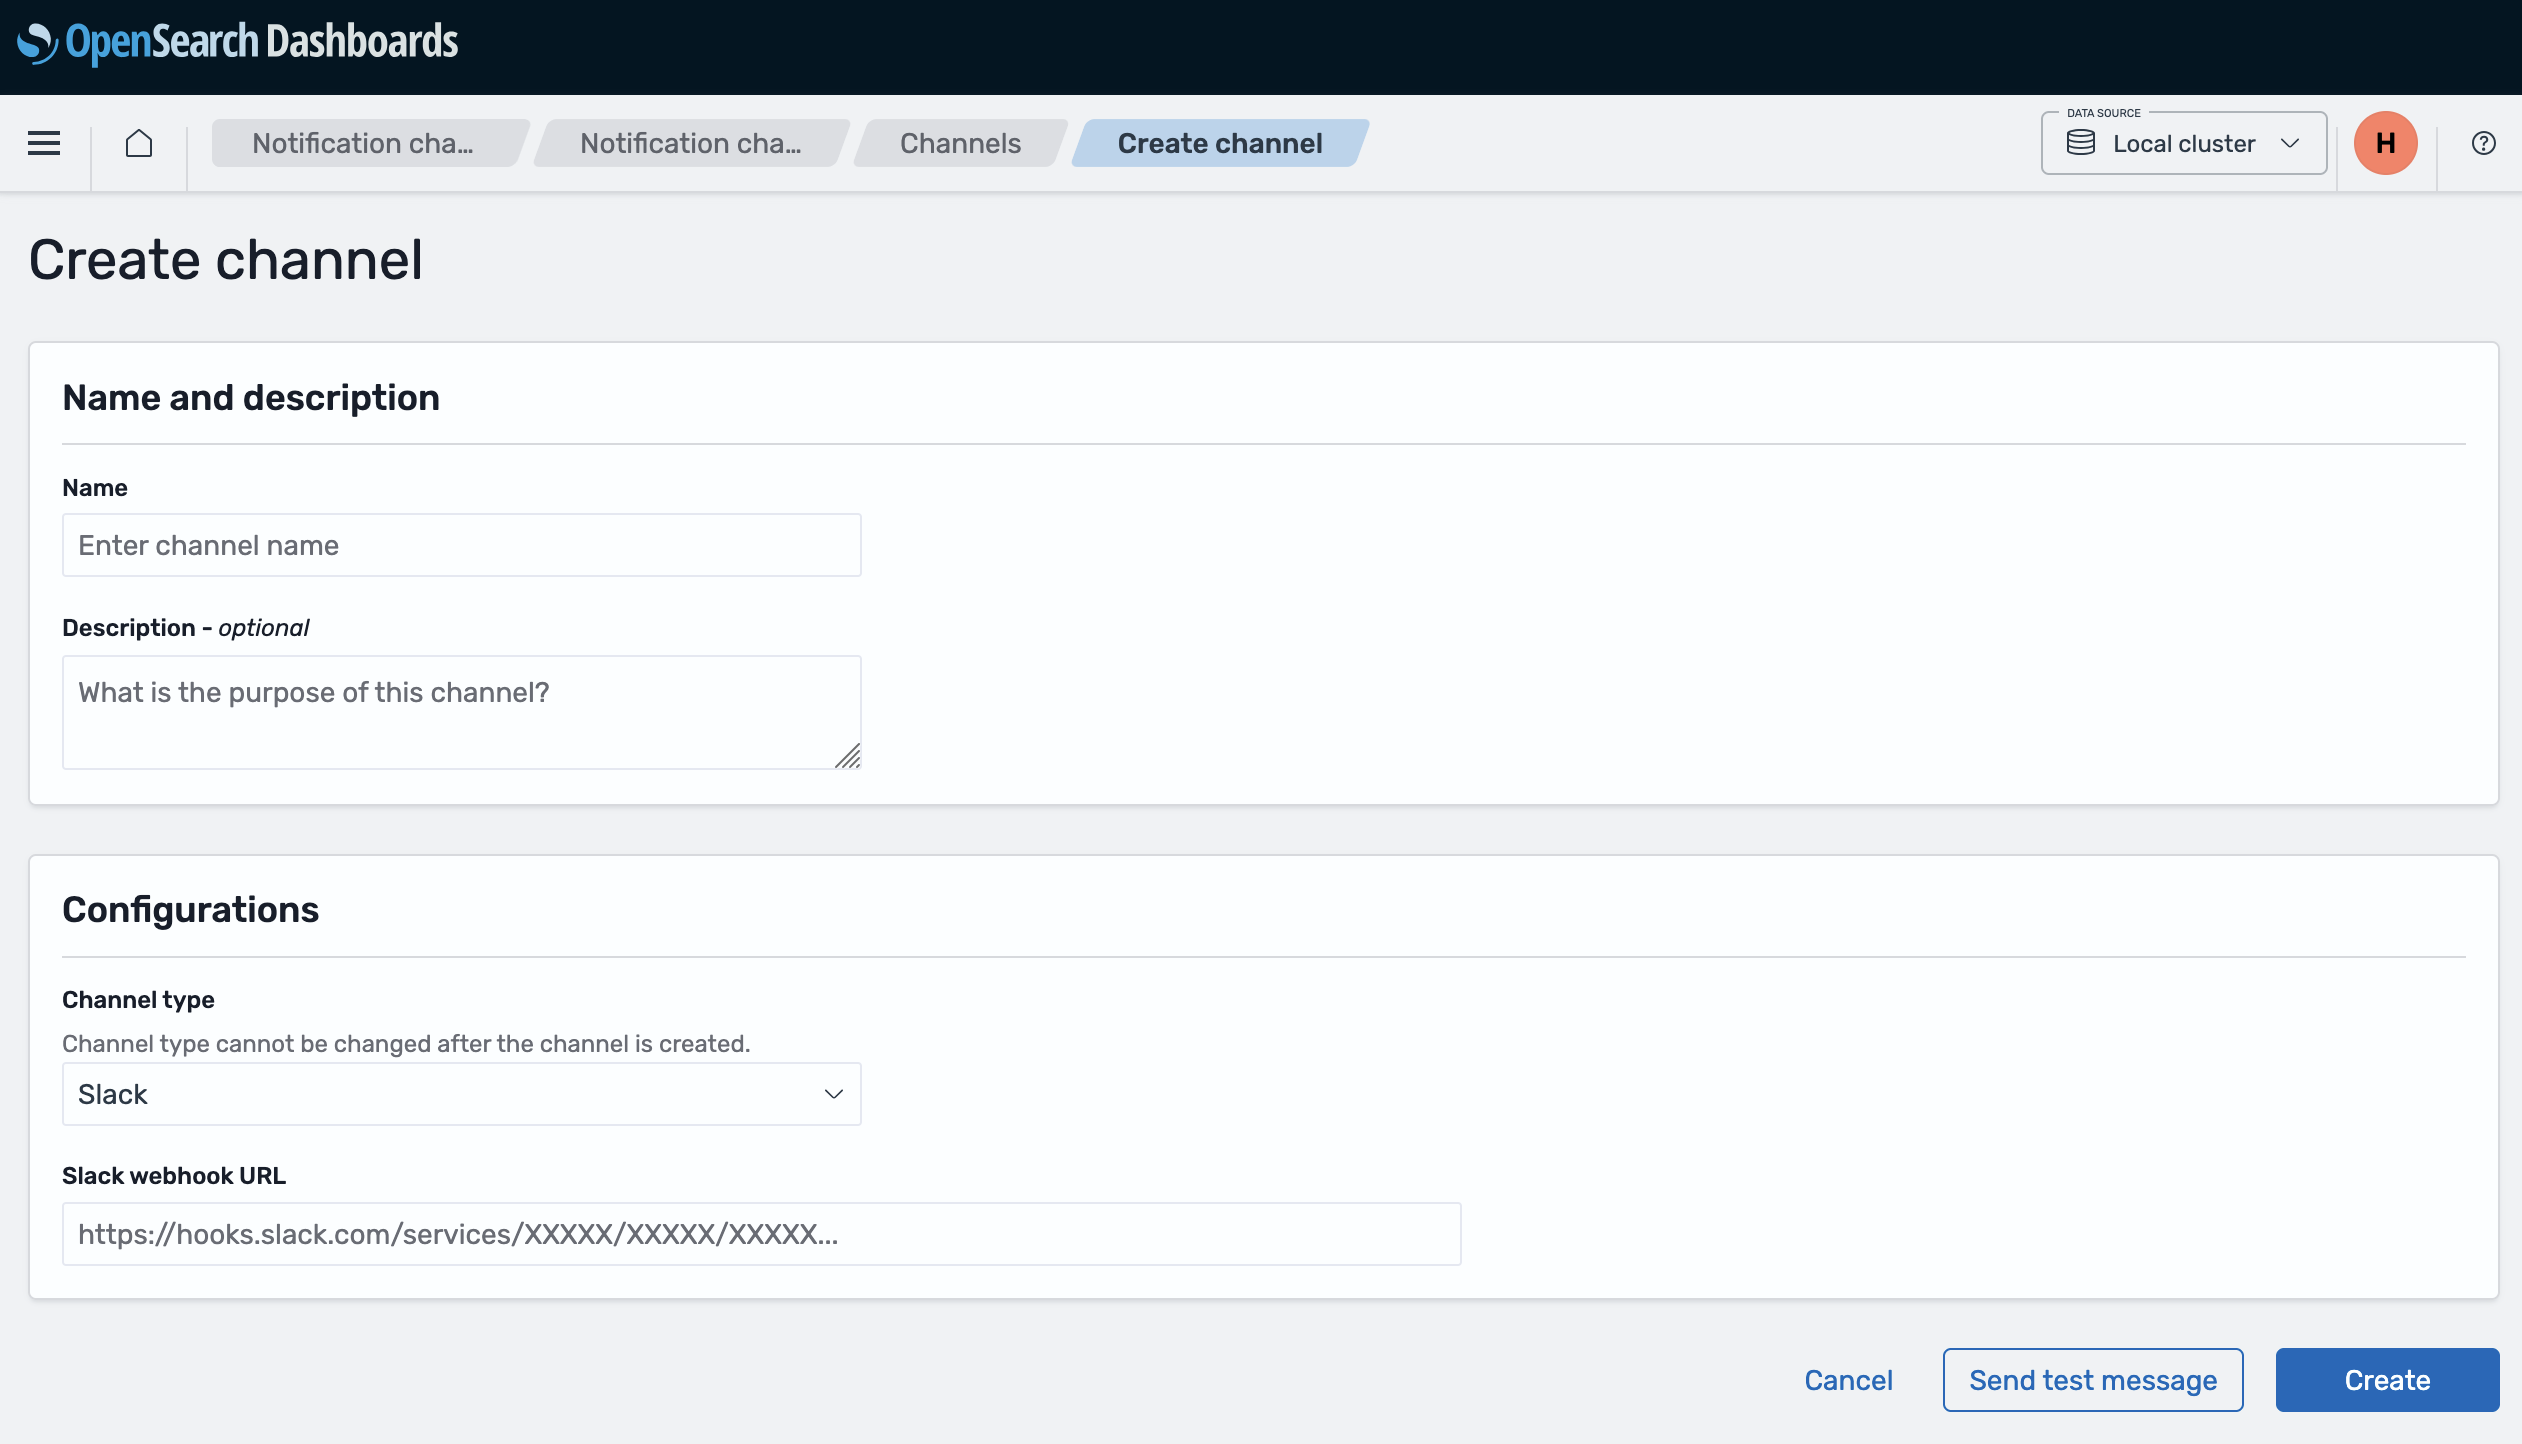
Create a new channel 
- Click Create channel
- Name: Give your channel a descriptive name (e.g., "my-team-slack-alerts")
- Channel type: Select Slack
- Slack webhook URL: Paste your Slack incoming webhook URL
- To create a webhook: Go to your Slack workspace → Apps → Incoming Webhooks
- Configure which channel receives notifications and copy the webhook URL
-
- Click Create
Test your channel
Use the "Send test message" button to verify the channel works before creating monitors.
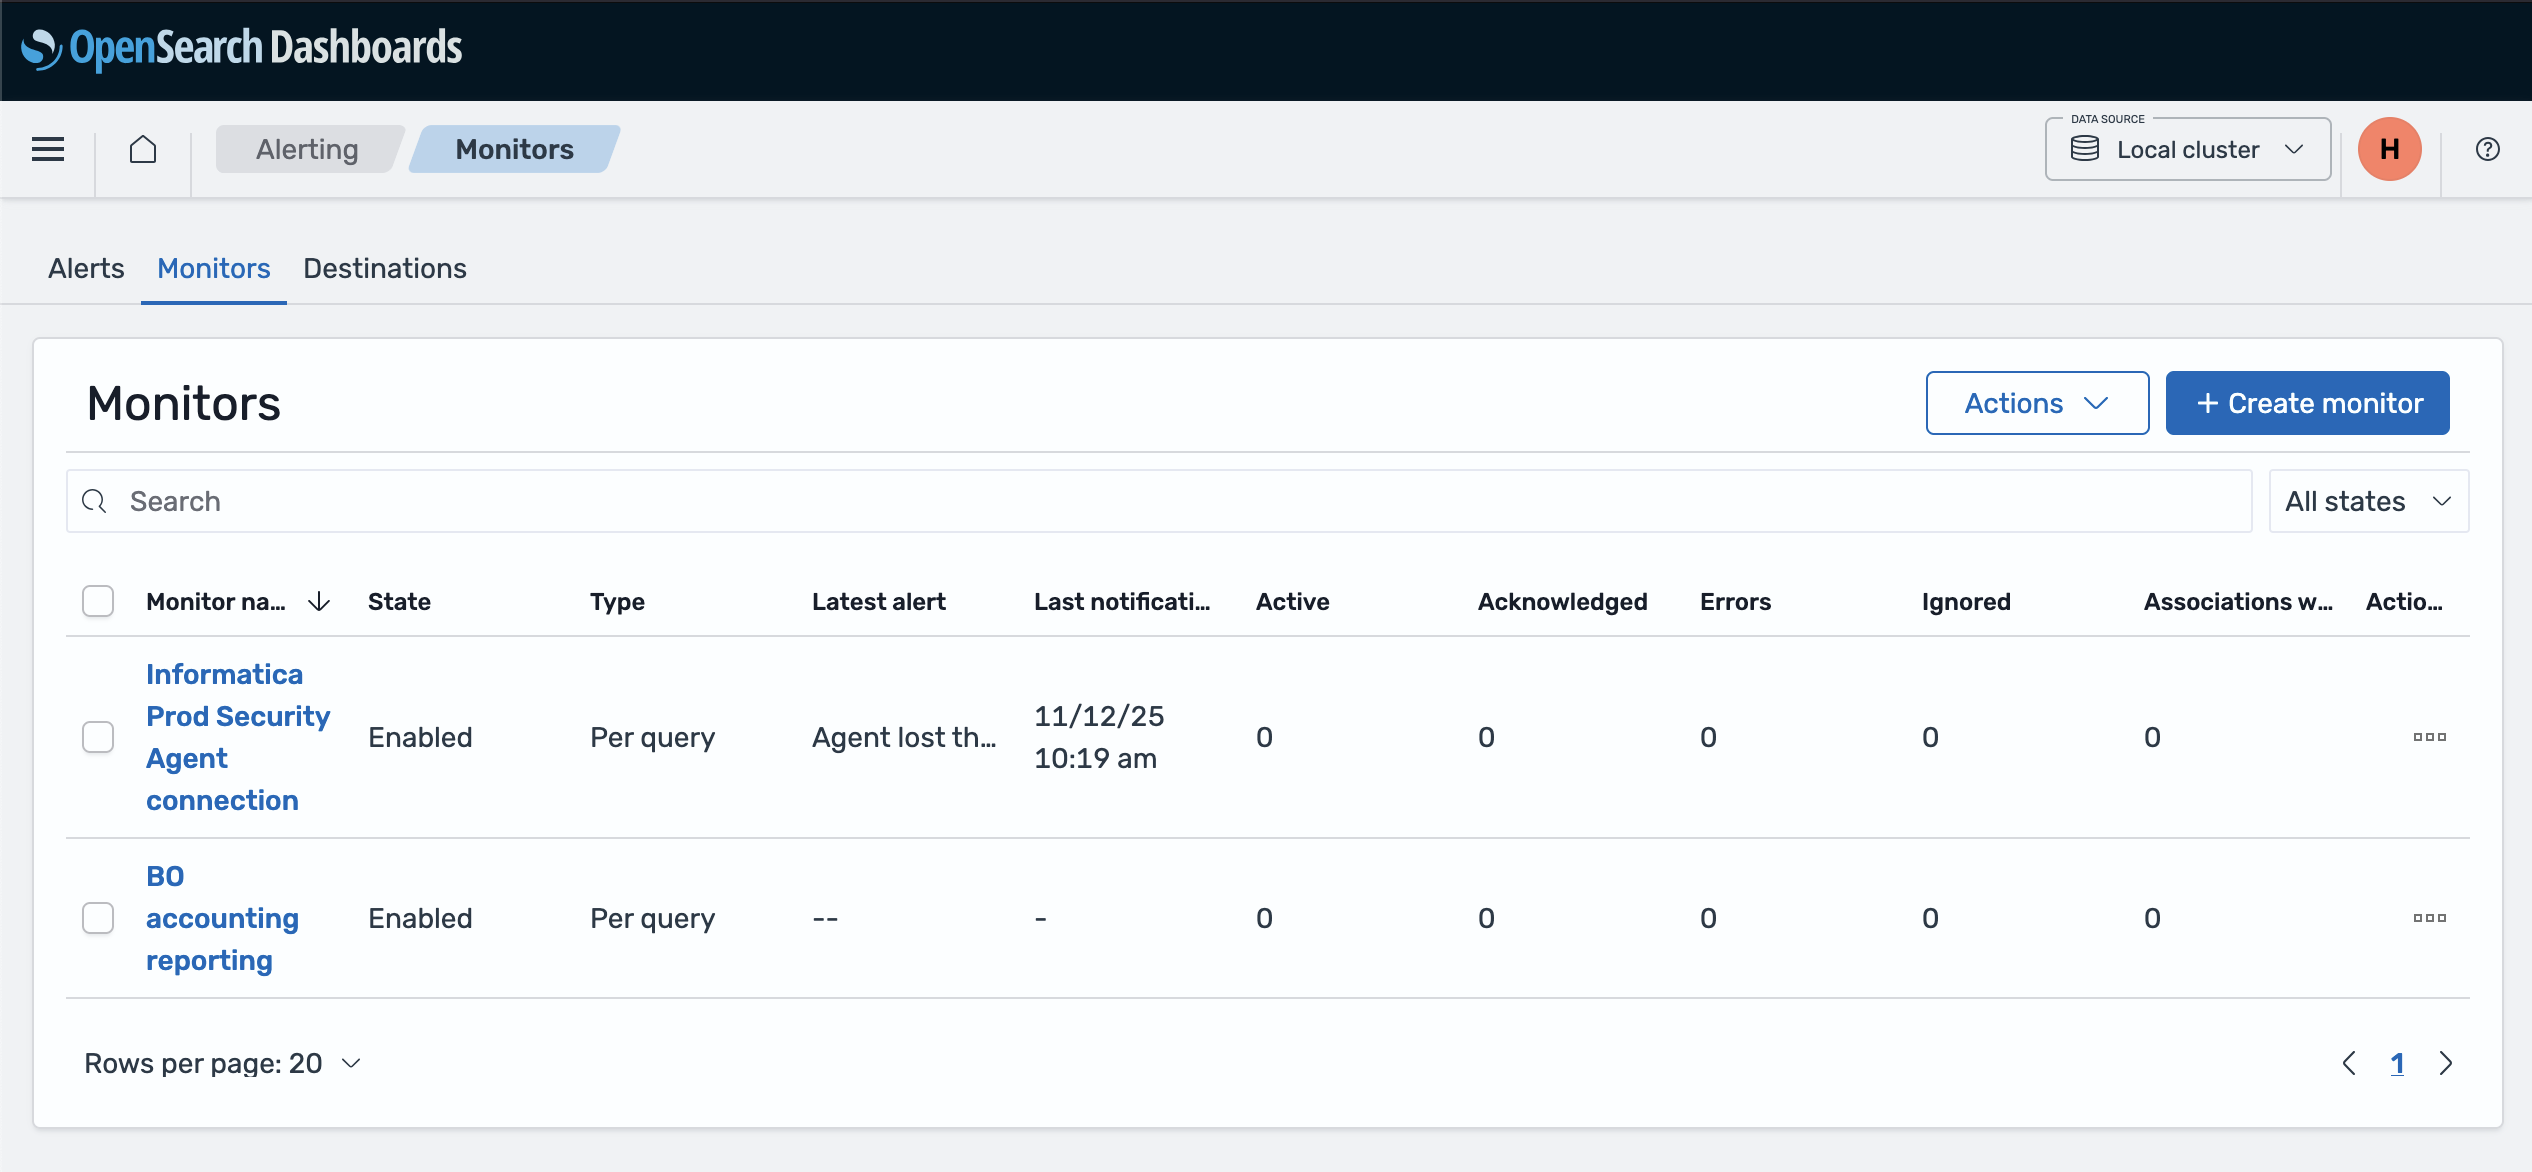
Step 2: Create a monitor 
Monitors run queries on your logs at scheduled intervals and trigger alerts when conditions are met.
Access monitors 
- Go directly to the Create monitor page
- Or navigate from the menu: Alerting → Monitors → Create monitor
Configure monitor basics 
- Monitor name: Give your monitor a descriptive name (e.g., "BO accounting reporting")
- Monitor type: Select Per query monitor (this is what you're familiar with from logs.adeo.no)
- Schedule: Set how often to check (e.g., every 5 minutes)
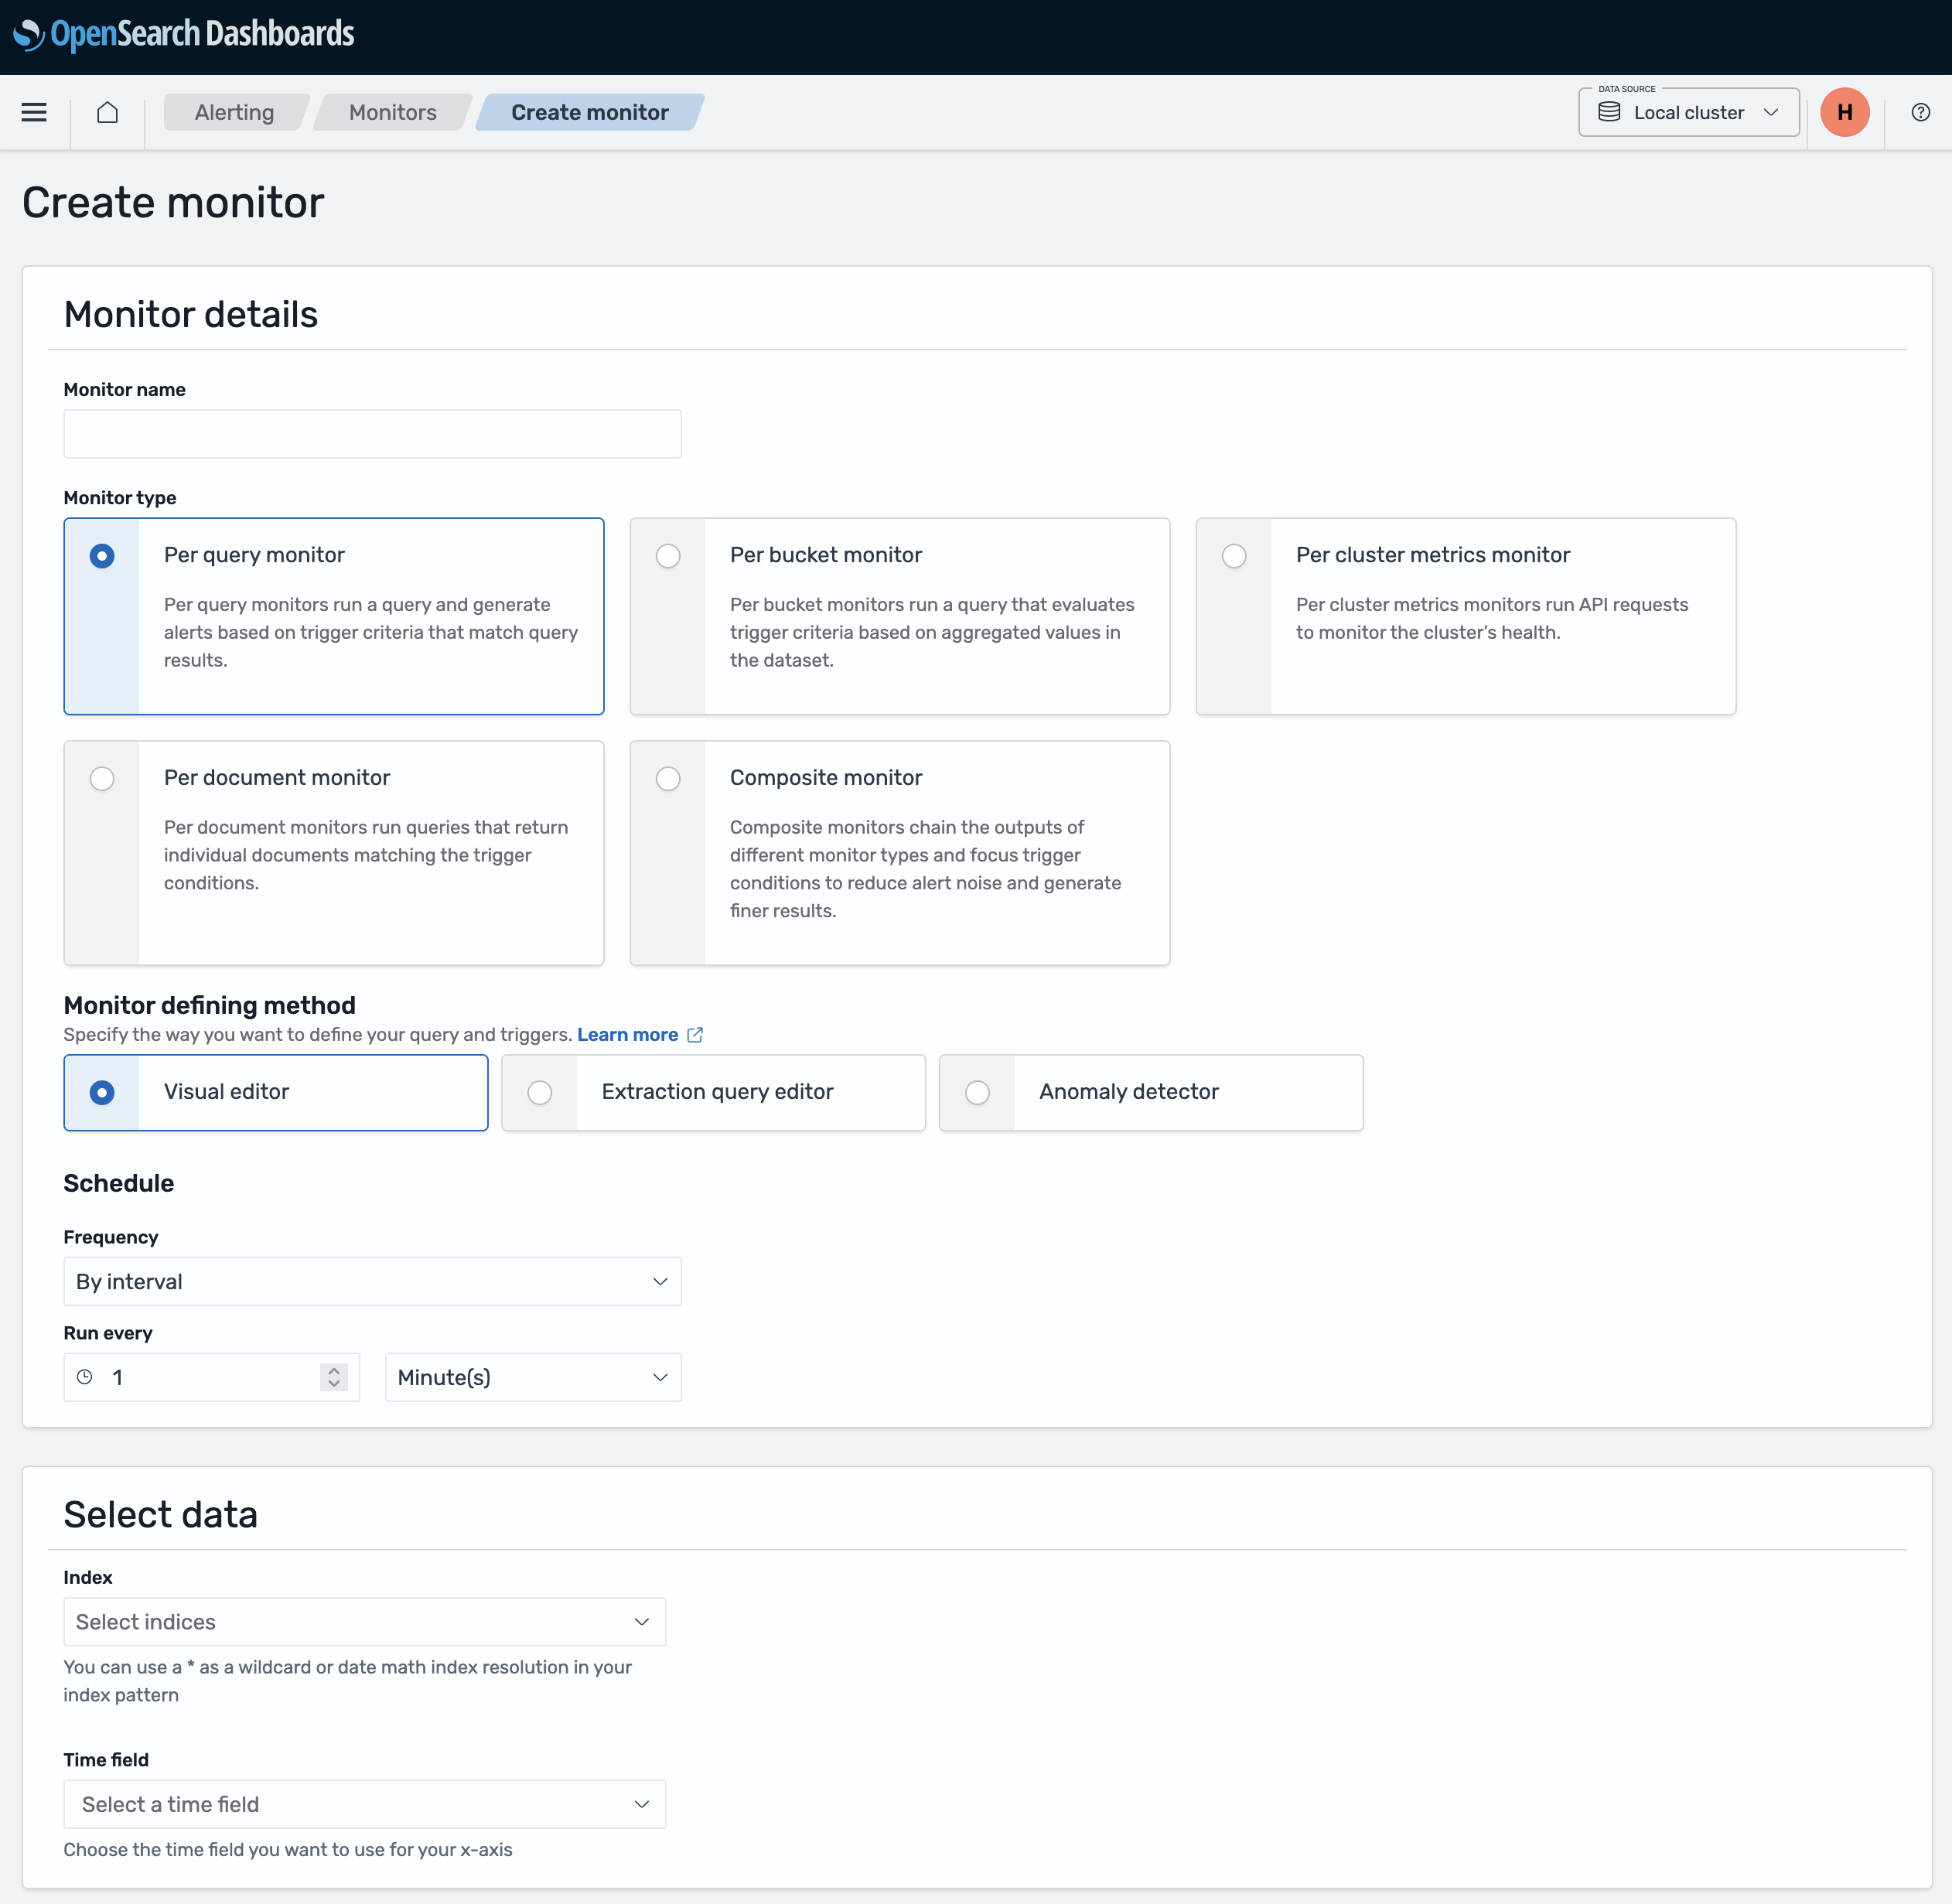
Define what to monitor 
- Index: Enter the data stream name or pattern:
-
logs.nais- Nais application logs -
logs.aura- Aura database logs -
logs.datapower- DataPower logs -
logs*- All log types (supports current and future data streams)
-
- Time field: Select
@timestamp
Define your query 
You can define your query using one of two methods:
Method 1: Visual editor 
Use the visual editor to build your query with filters:
Query examples:
application: "my-app" AND level: "ERROR"
application: "my-app" AND message: "Database connection failed"
namespace: "myteam" AND level: "ERROR"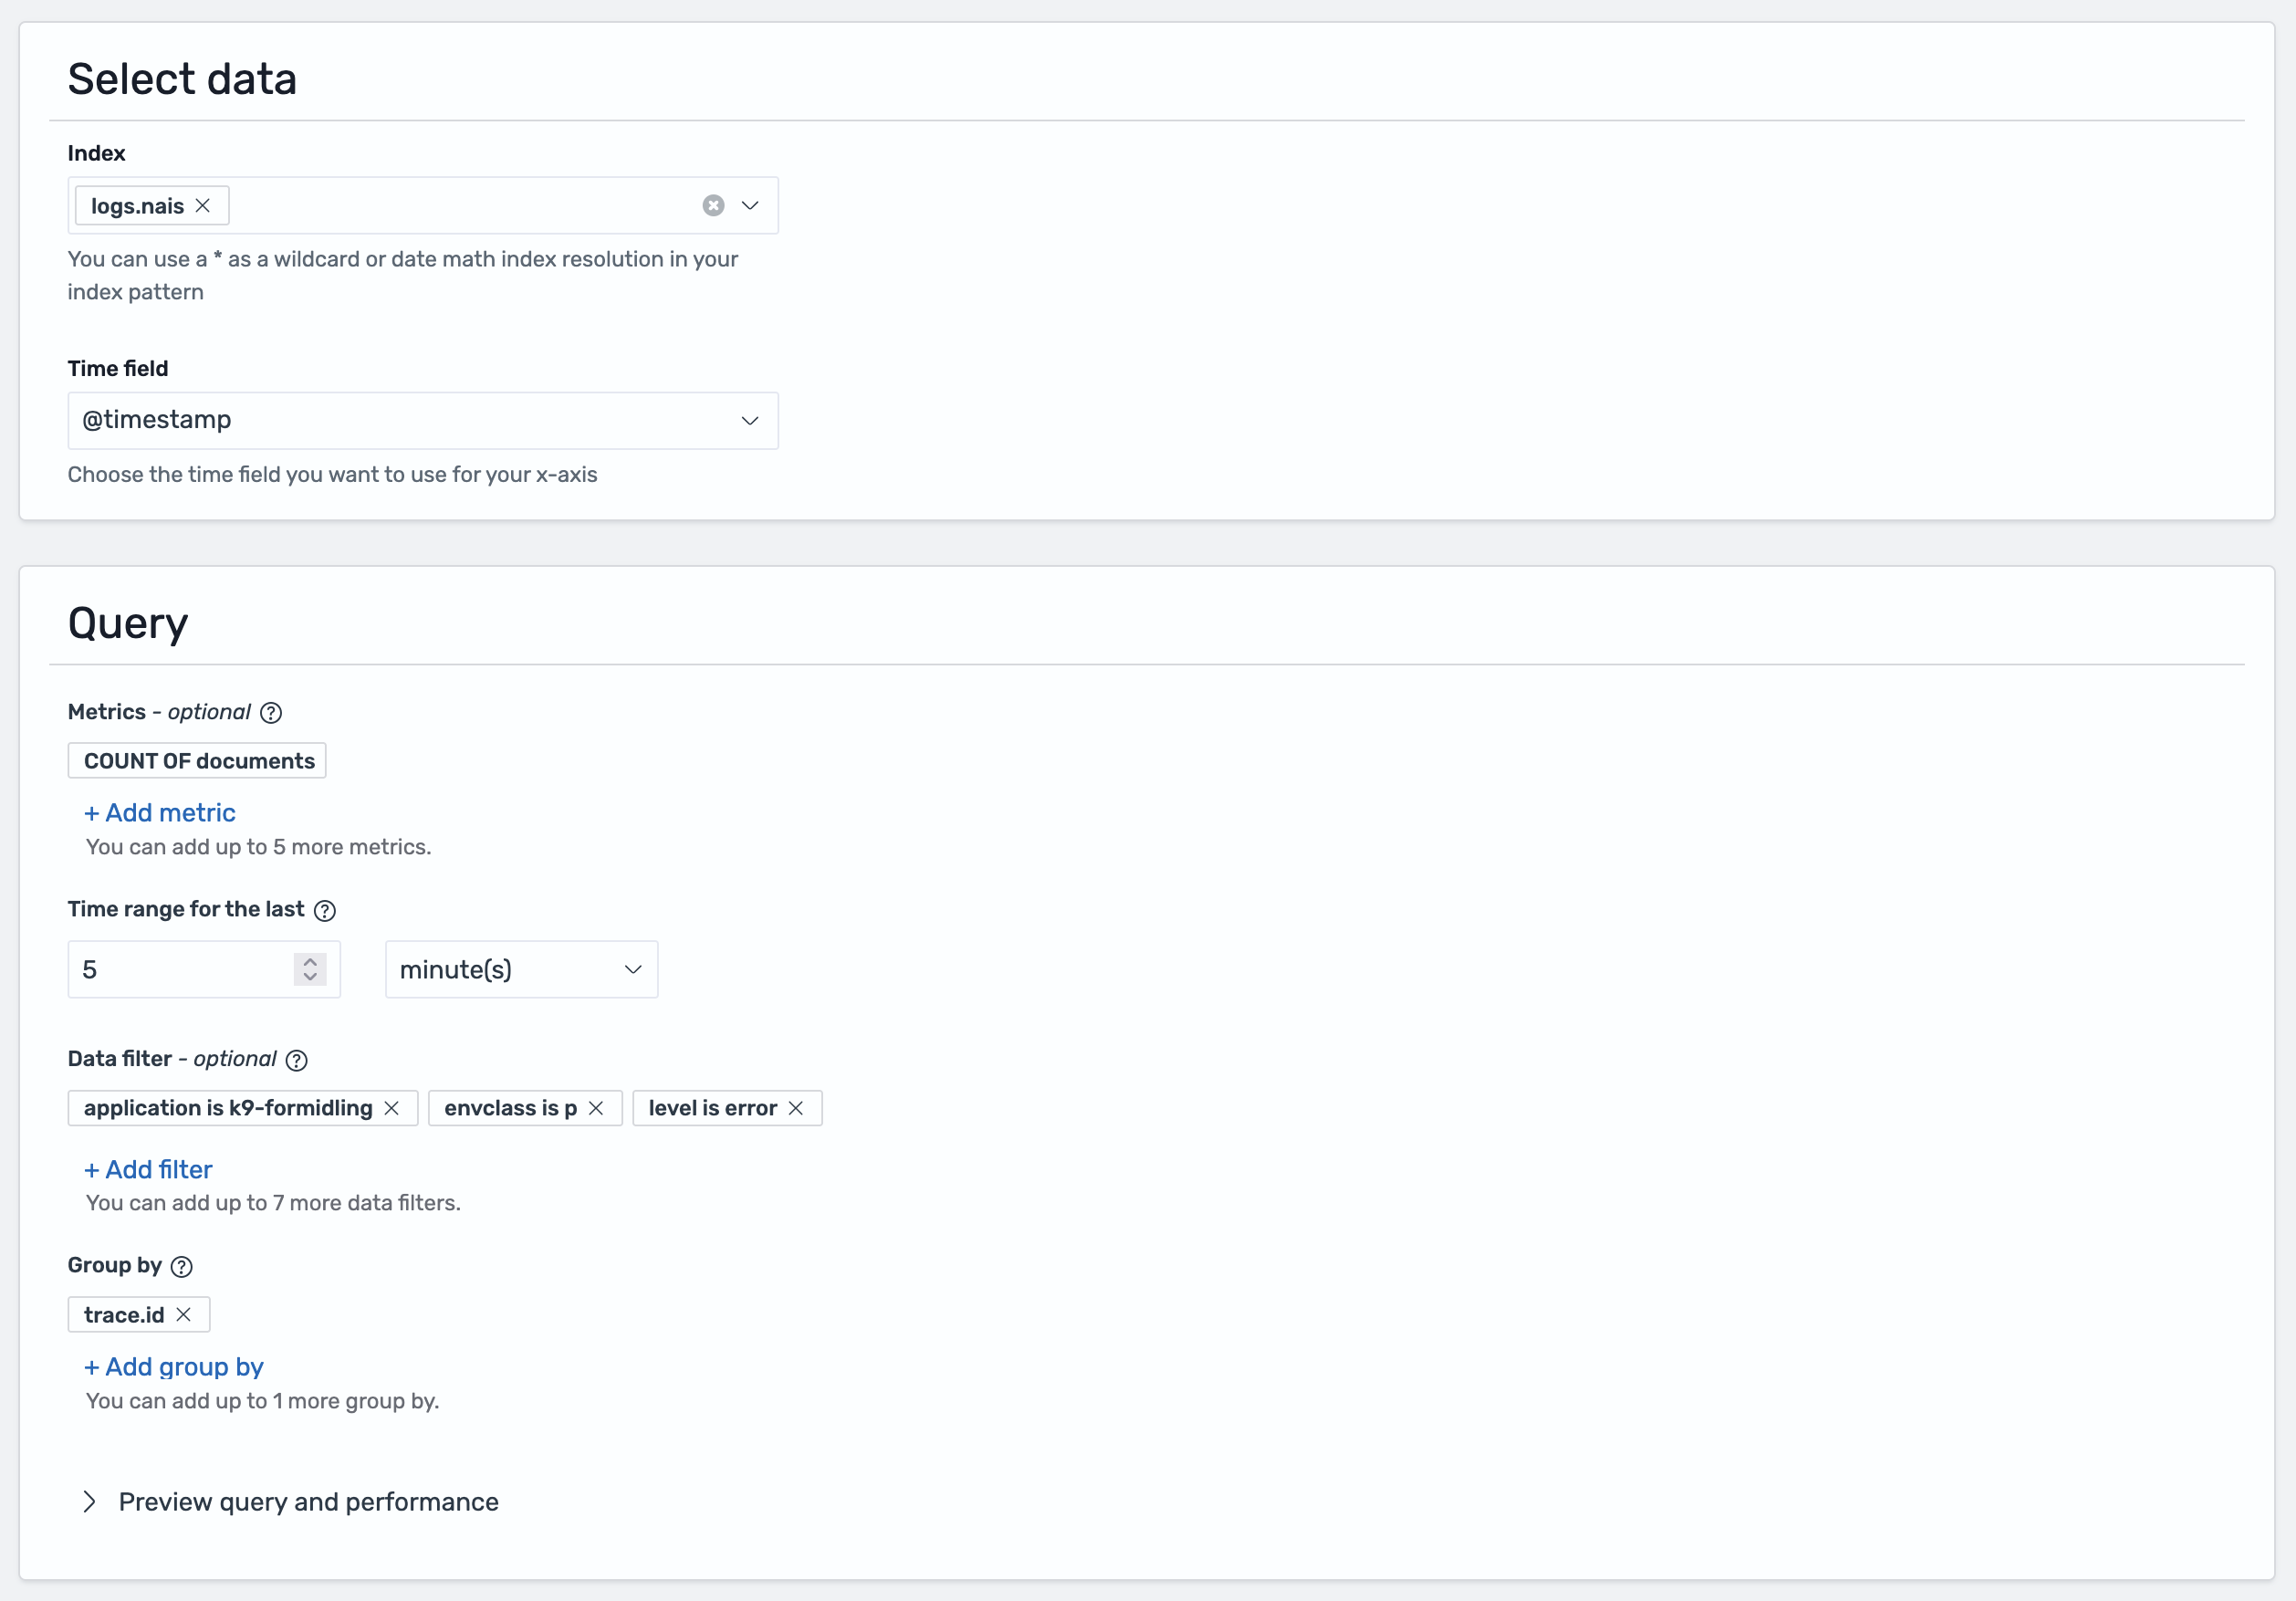
Method 2: Extraction query editor 
For more complex queries, you can write the query yourself:
- First, test your search in the Discover tab to find what you're looking for
- Click Inspect in the top-right corner of the screen
- Select the Request tab
- Scroll down to find the query being used to show your results
- Copy this query and paste it into the Extraction query editor when creating your monitor
Tip
Test your query in Discover first to ensure it returns the expected results before creating a monitor.
Step 3: Create a trigger 
Triggers define the threshold for when an alert should be sent and specify which notification channel to use.
Add a trigger 
- Click Add trigger
- Trigger name: Describe the condition (e.g., "High error rate")
- Severity level: Select 1-5 (1 is highest priority)
- Trigger condition: Define the threshold for when to alert
Common conditions:
ctx.results[0].hits.total.value > 10    # More than 10 errors
ctx.results[0].hits.total.value > 0     # Any errors found
ctx.results[0].hits.total.value == 0    # No logs found (missing expected events)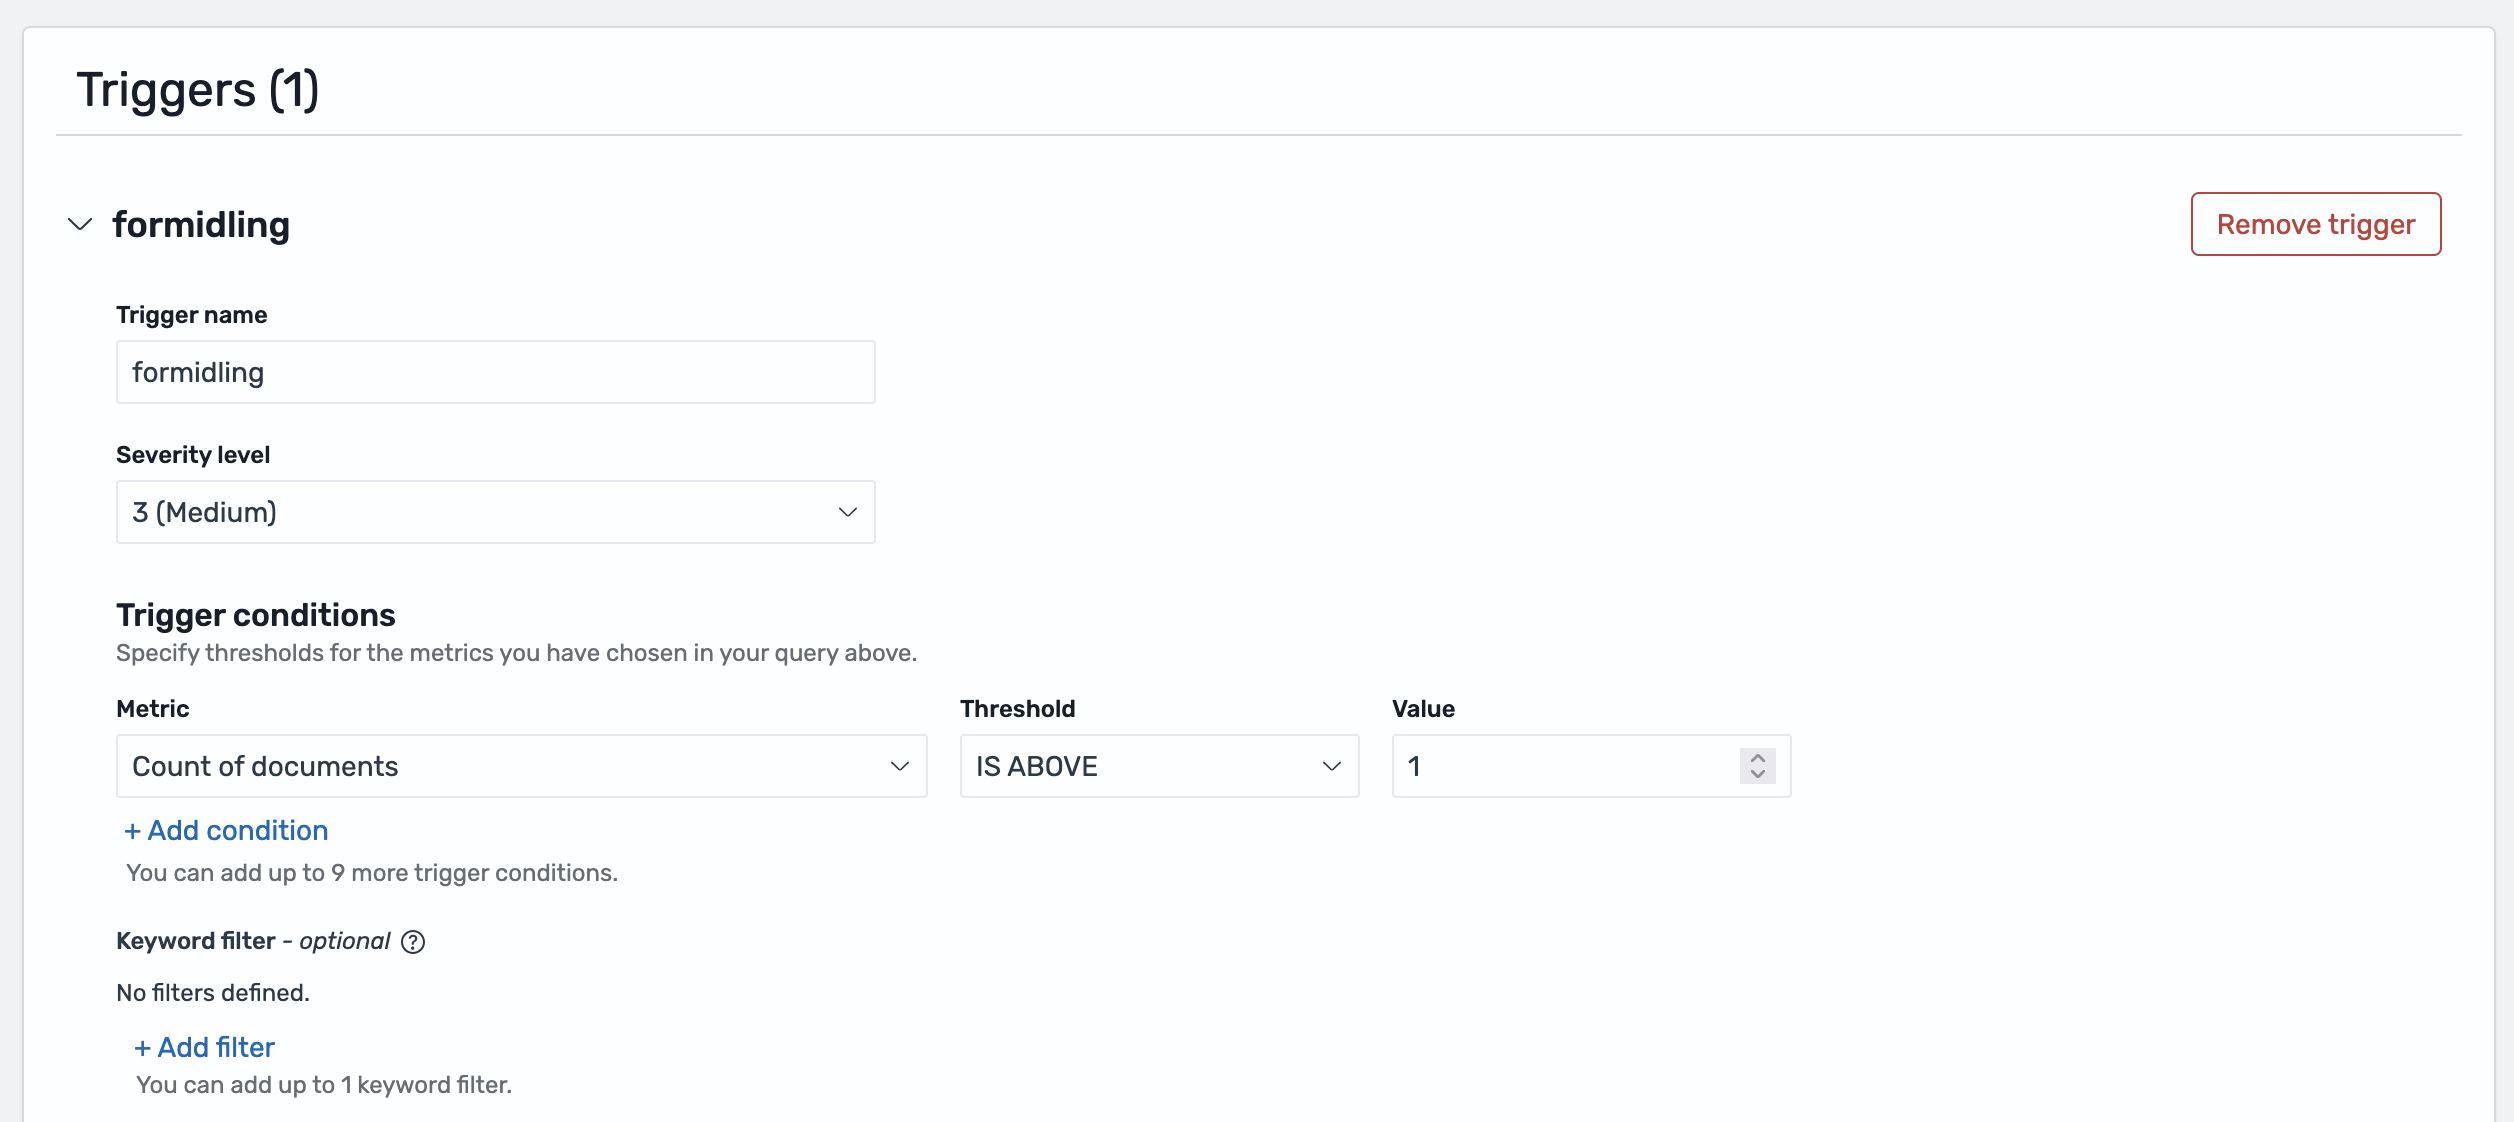
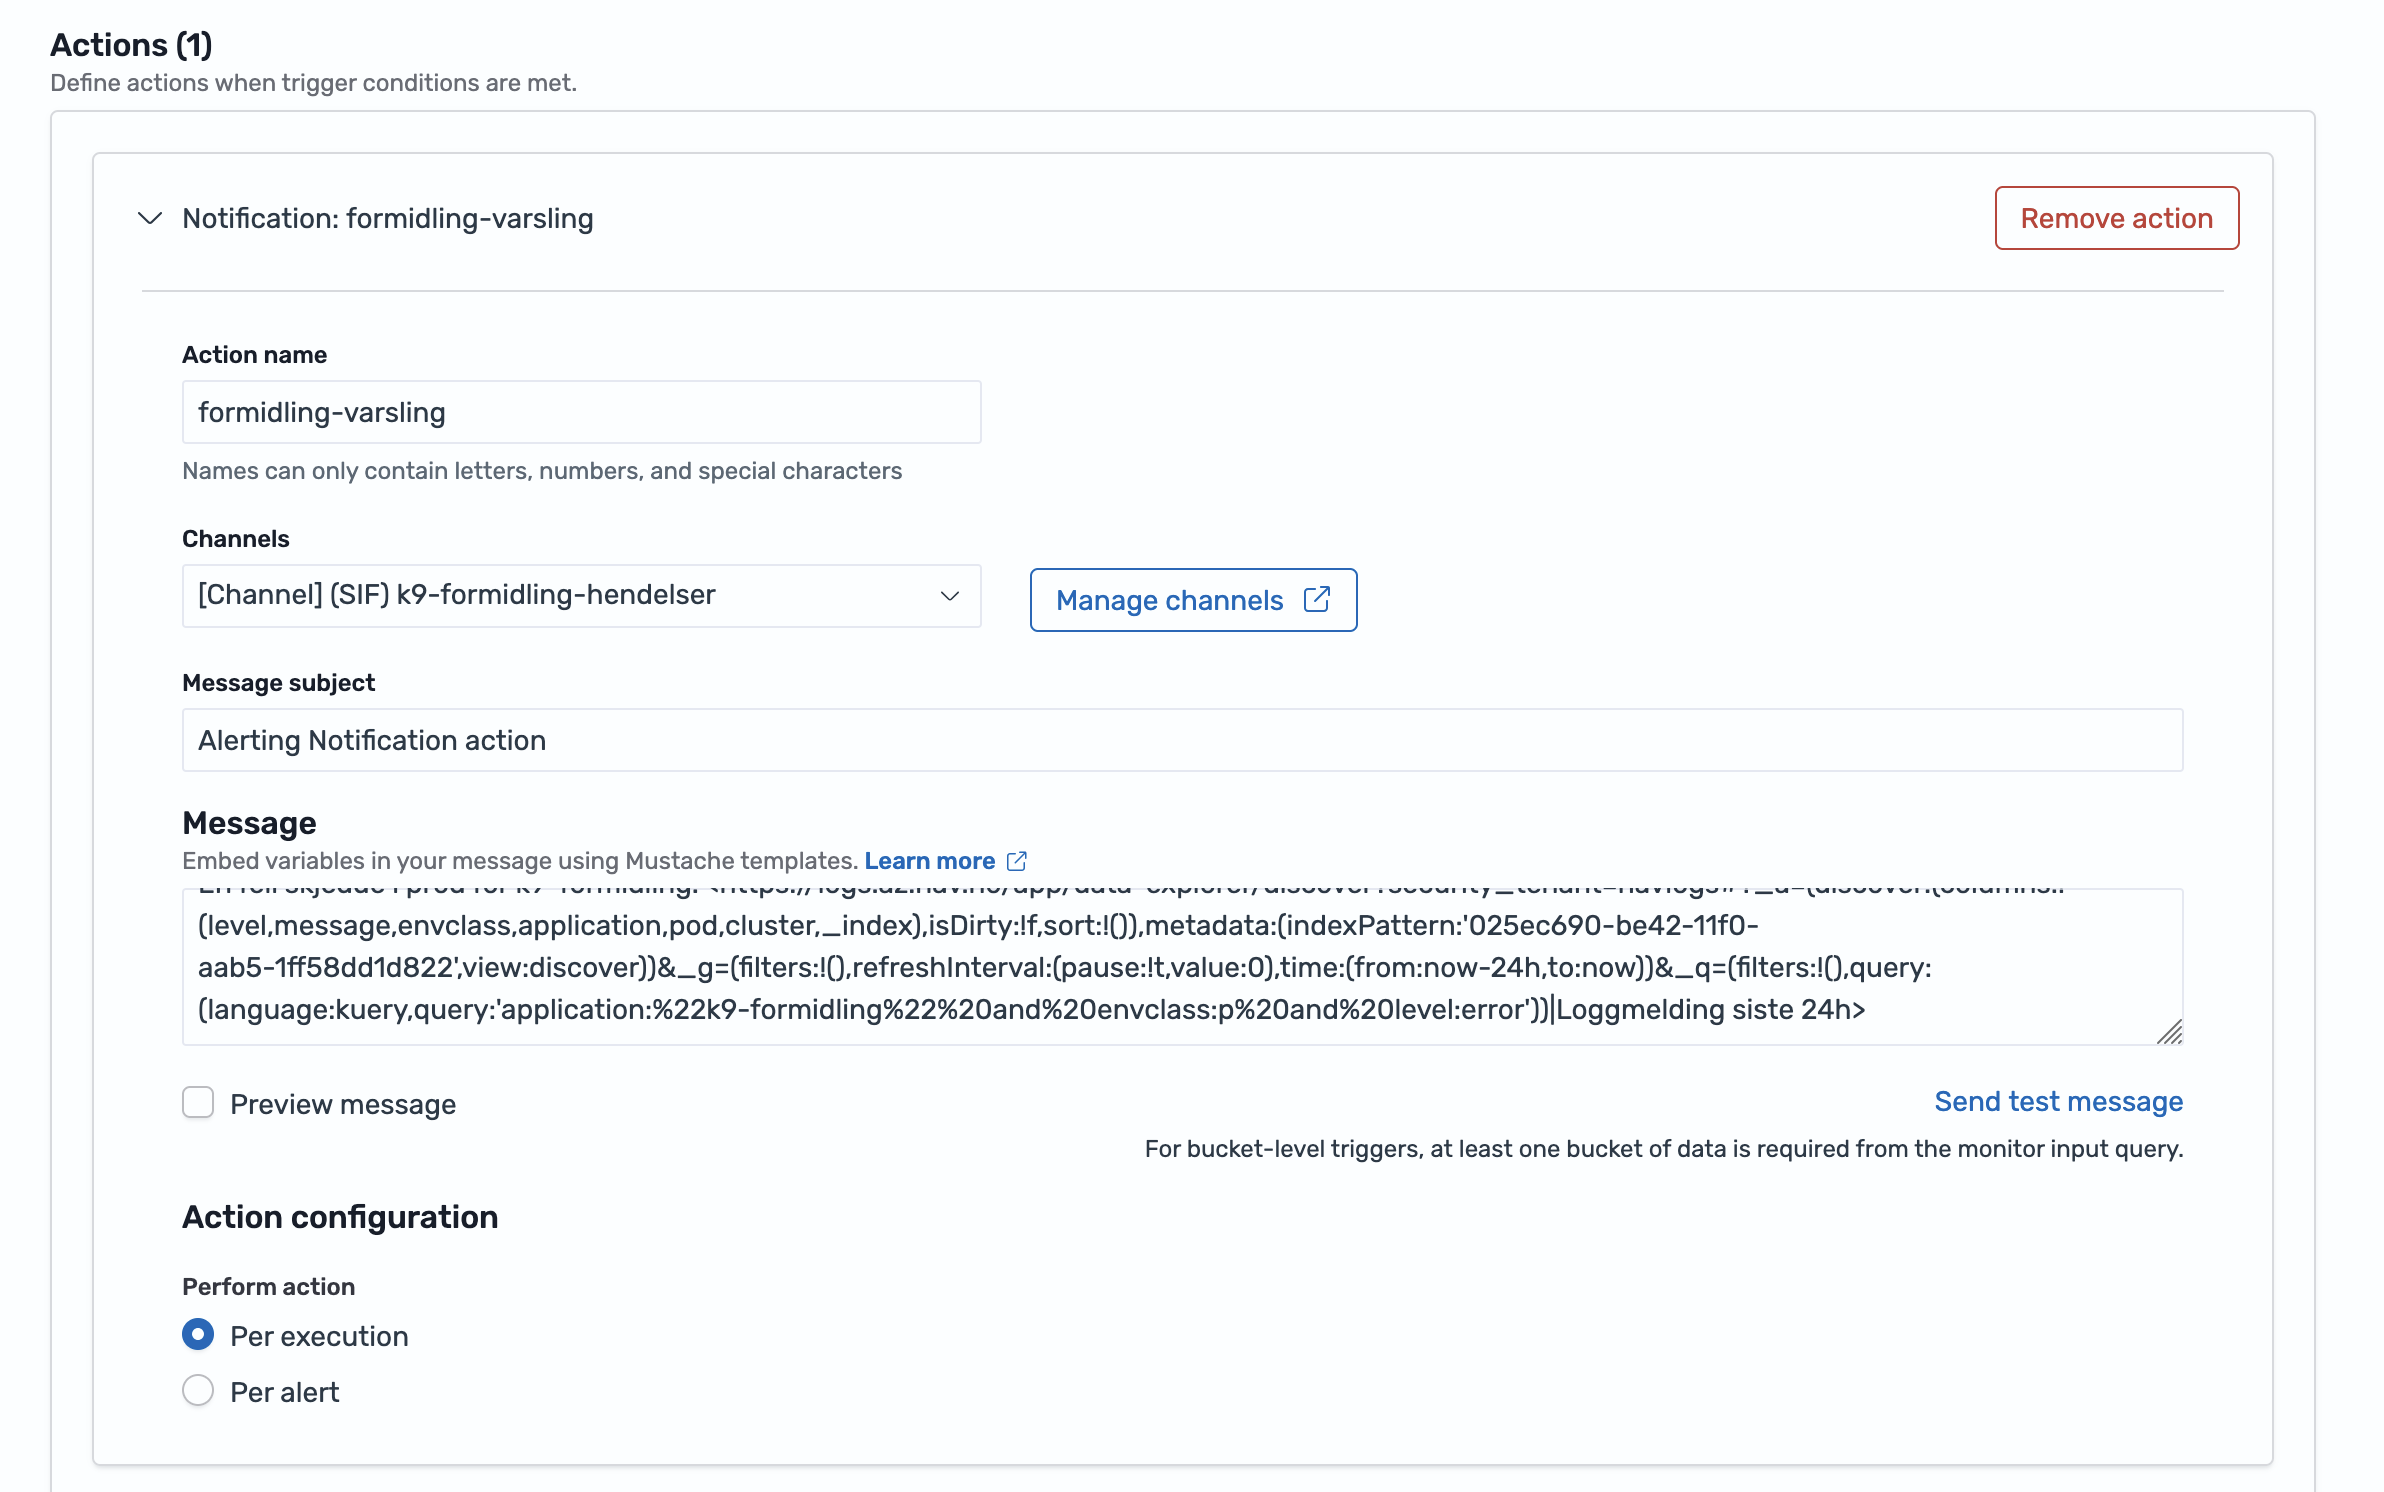
Configure action 
Under the Action section of the trigger, select where the alert should be sent.
Info
You must have already created a notification channel (Step 1) before you can select it here.
- Click Add action
- Action name: e.g., "Notify team Slack"
- Destination: Select your notification channel (created in Step 1)
- Message: Customize the alert content
Example message:
⚠️ Alert: {{ctx.monitor.name}}

Found {{ctx.results.0.hits.total.value}} errors
Time: {{ctx.periodStart}} to {{ctx.periodEnd}}

View logs: https://logs.az.nav.no
Useful variables:
-
{{ctx.monitor.name}}- Monitor name -
{{ctx.trigger.name}}- Trigger name -
{{ctx.results.0.hits.total.value}}- Number of matches -
{{ctx.periodStart}}/{{ctx.periodEnd}}- Time period
Enable throttling (optional) 
To prevent alert spam:
- Throttling: Enable and set time window (e.g., 10 minutes)
- This limits how often notifications are sent
Save 
Click Create to save your monitor. It will start running on the schedule you defined.
Complete example 
Here's a quick example monitoring for missing accounting reports:
Notification channel:
- Name:
bo-team-slack - Type: Slack
Monitor:
- Name:
BO accounting reporting - Type: Per query monitor
- Schedule: Every 5 minutes
- Index:
logs.nais - Time field:
@timestamp - Query:
application: "bo-accounting" AND message: "accounting report sent"
Trigger:
- Name:
BO does not send accounting - Condition:
ctx.results[0].hits.total.value == 0(alerts when no logs found) - Action: Send to
bo-team-slack
Troubleshooting 
Monitor not triggering:
- Test your query in Discover first
- Check the time range covers when logs appear
- Verify the trigger condition is correct
No notifications received:
- Test the notification channel with "Send test message"
- Check the channel is selected in the action
- Verify throttling isn't blocking notifications
Too many alerts:
- Increase the trigger threshold
- Enable throttling to limit notification frequency
- Make your query more specific
Related documentation 
- Loki alerts (recommended alternative)