Nais APM 
Nais APM is an app in your team's Grafana that gives every Nais service a single home for application performance monitoring: a health overview, an issues list across frontend and backend errors, endpoint and database analytics, traces, and logs — built on the telemetry your apps already send to the platform.
You don't set anything up to get the basics. If your service produces traces, metrics, or logs on Nais, it already shows up in Nais APM.
This is the Legend release of Nais APM.
What you get 
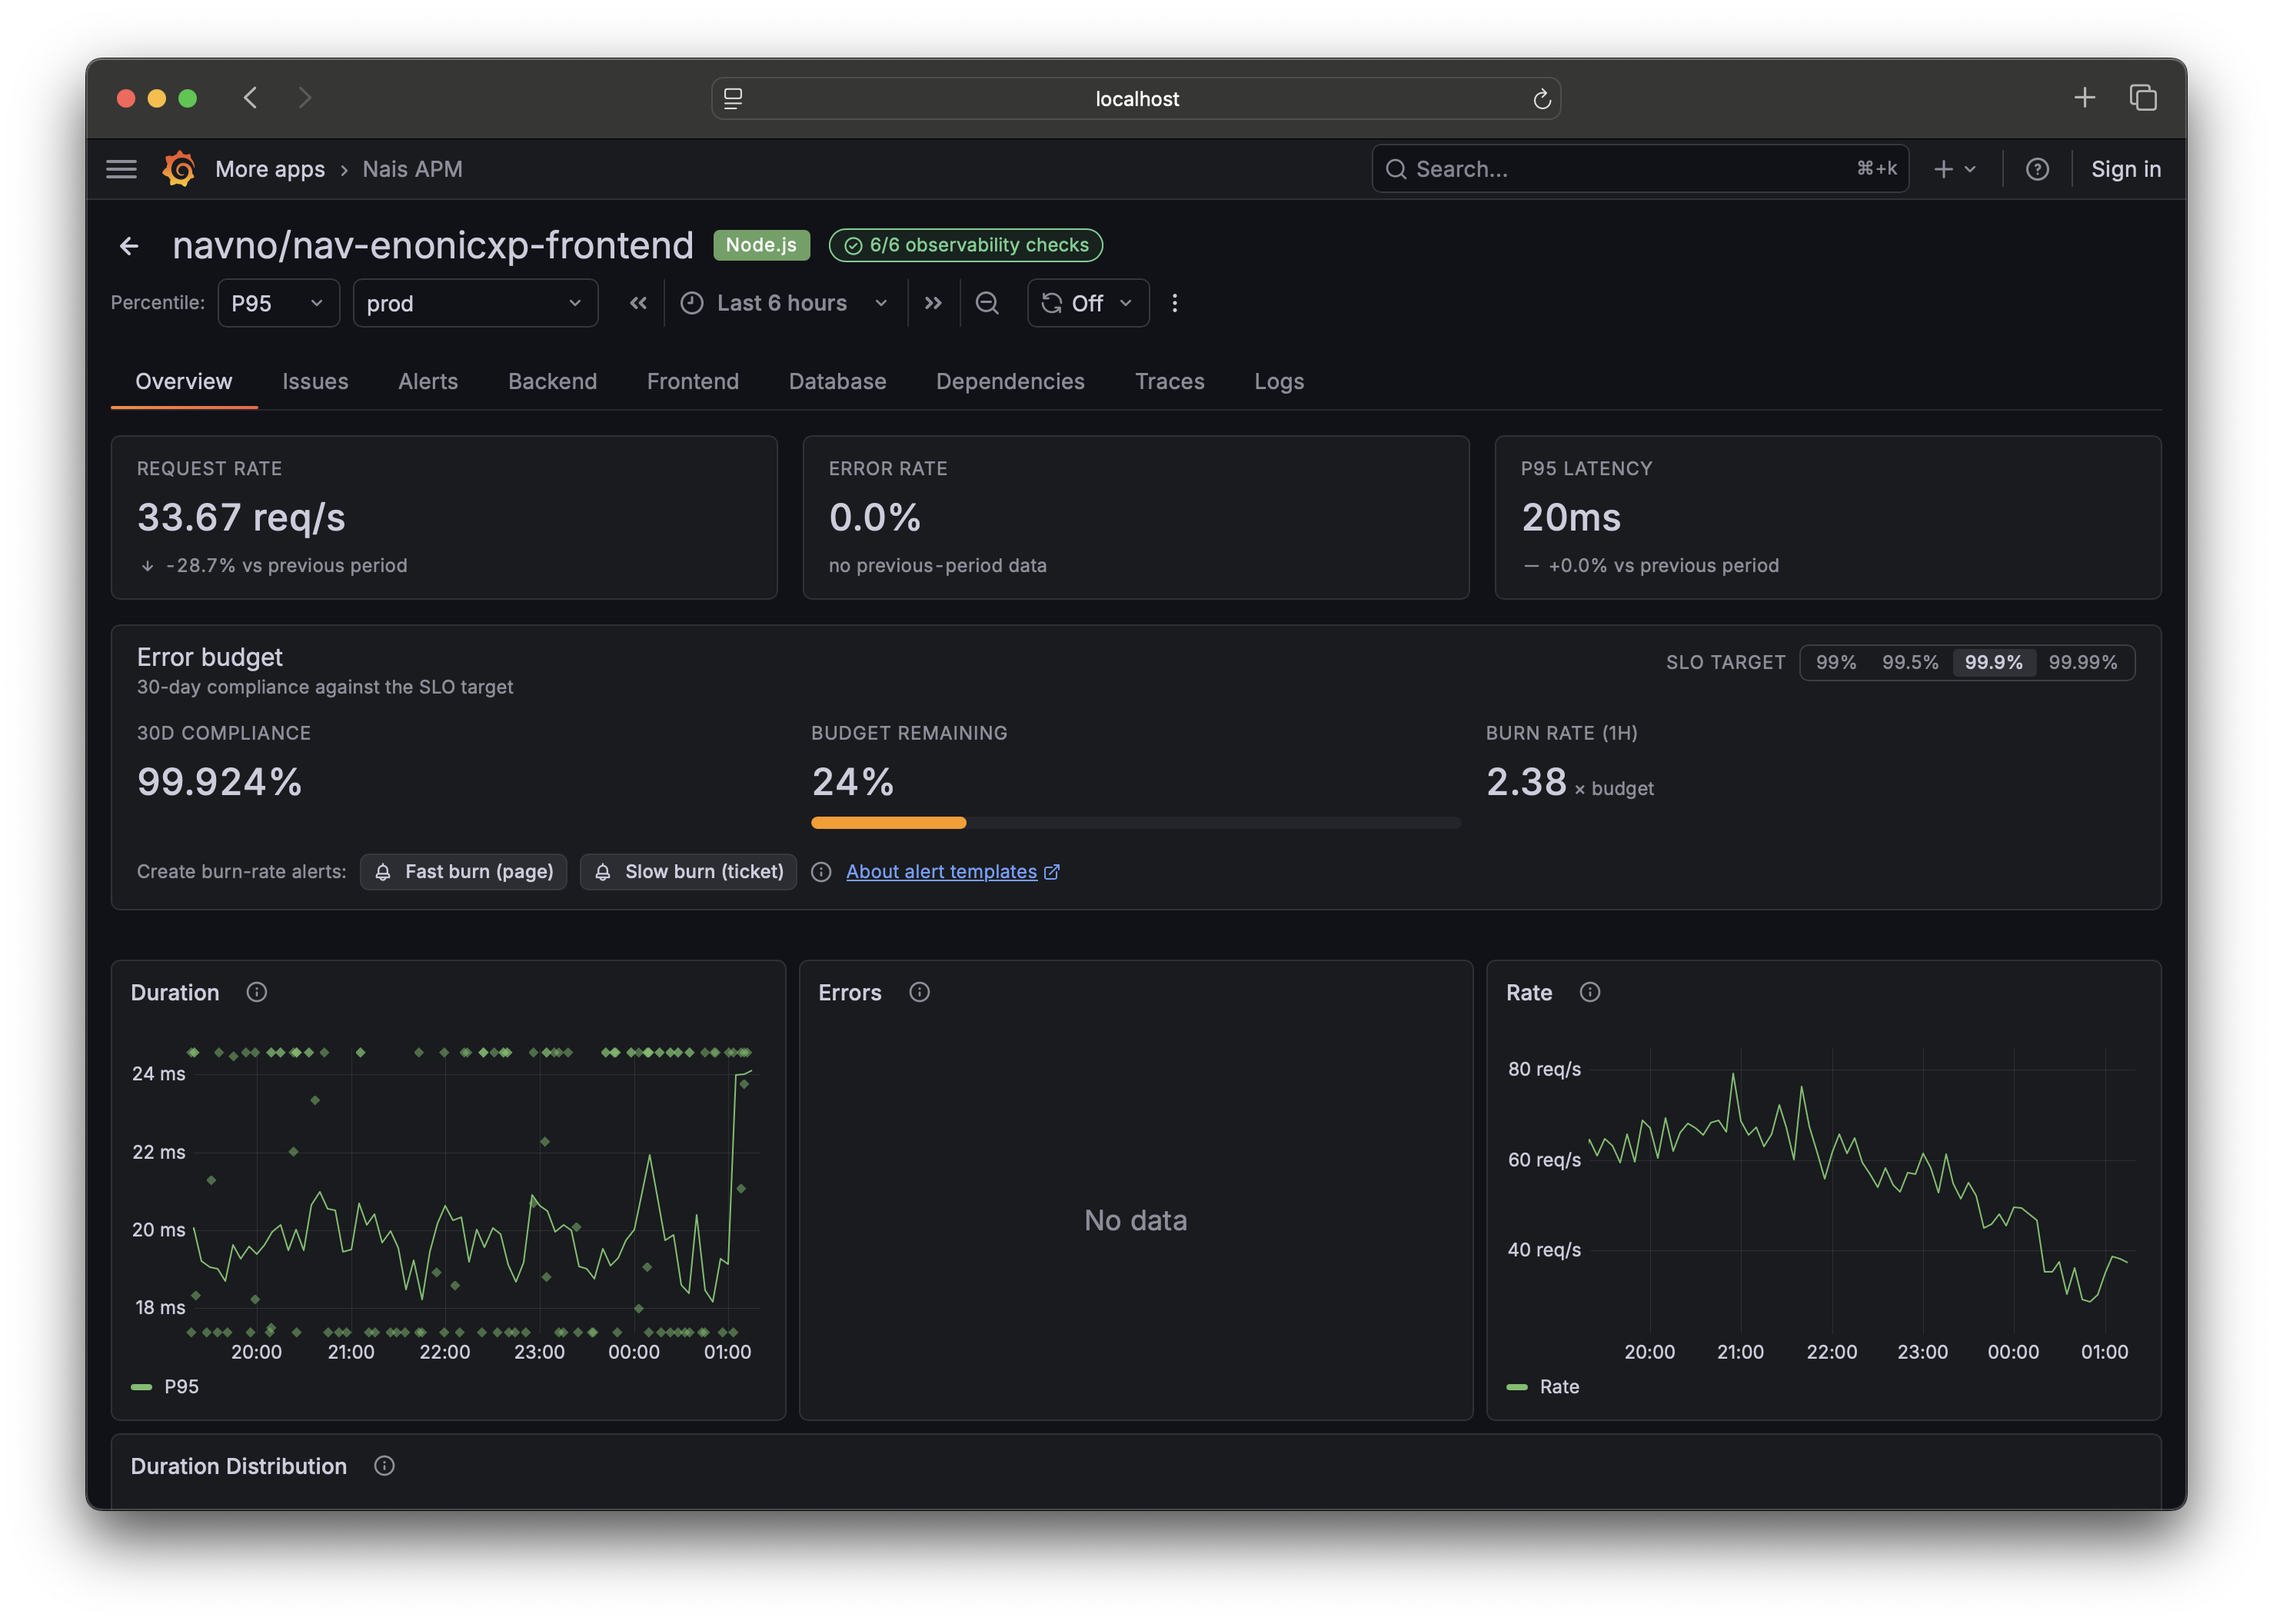
- Health overview — the RED signals (rate, errors, duration) as big numbers with a delta against the previous period, so "is this OK right now?" is one glance. Deploy markers show which release changed the picture.
- Issues — one list of errors across the browser and the backend, grouped into stable issues you can resolve, ignore, and assign.
- Backend — RED metrics per endpoint on top, with process and runtime internals (JVM and similar) below.
- Database — query analytics per operation and connection-pool health.
- Frontend — Core Web Vitals, page performance, and browser-side errors for apps using Grafana Faro or
@nais/apm. - Traces and Logs — search and drill in, with log patterns and trace breakdowns to find what explains an incident.
- A shared time picker — one time range across every tab, carried in the URL so links you share open on the same window.
Get started 
- 🎯 Get started with Nais APM — find your service and tour its health, issues, and traces.
- 🎯 Track frontend errors with
@nais/apm— add the SDK to a browser app and see errors as issues.
Guides 
| Guide | Description |
|---|---|
| Triage an issue | Resolve, ignore, assign, and understand regressions |
| Create alerts from templates | Error-rate, exception-spike, web-vitals, and new-exception alerts |
| Enable session replay | Opt in to masked screen recording for your app (preview) |
| Make database queries visible | The instrumentation the Database tab needs |
| Use log patterns during an incident | Group noisy logs into a handful of patterns |
Reference 
| Page | Description |
|---|---|
@nais/apm API | Every export, signature, and option |
| Issues and fingerprinting | What makes two errors "the same issue" |
| URL and deep-link contract | Stable links for alerts, runbooks, and shared investigations |
Understand it 
💡 How Nais APM works — where your telemetry comes from and where it lives, why issue grouping is computed at query time, and what Nais APM deliberately does not do.