Get started with Nais APM 
This tutorial takes you from zero to reading your service's health, issues, and traces in Nais APM. You don't install anything — if your app runs on Nais and produces telemetry, it's already there.
Prerequisites 
- A Nais application deployed to a cluster.
- Access to your team's Grafana.
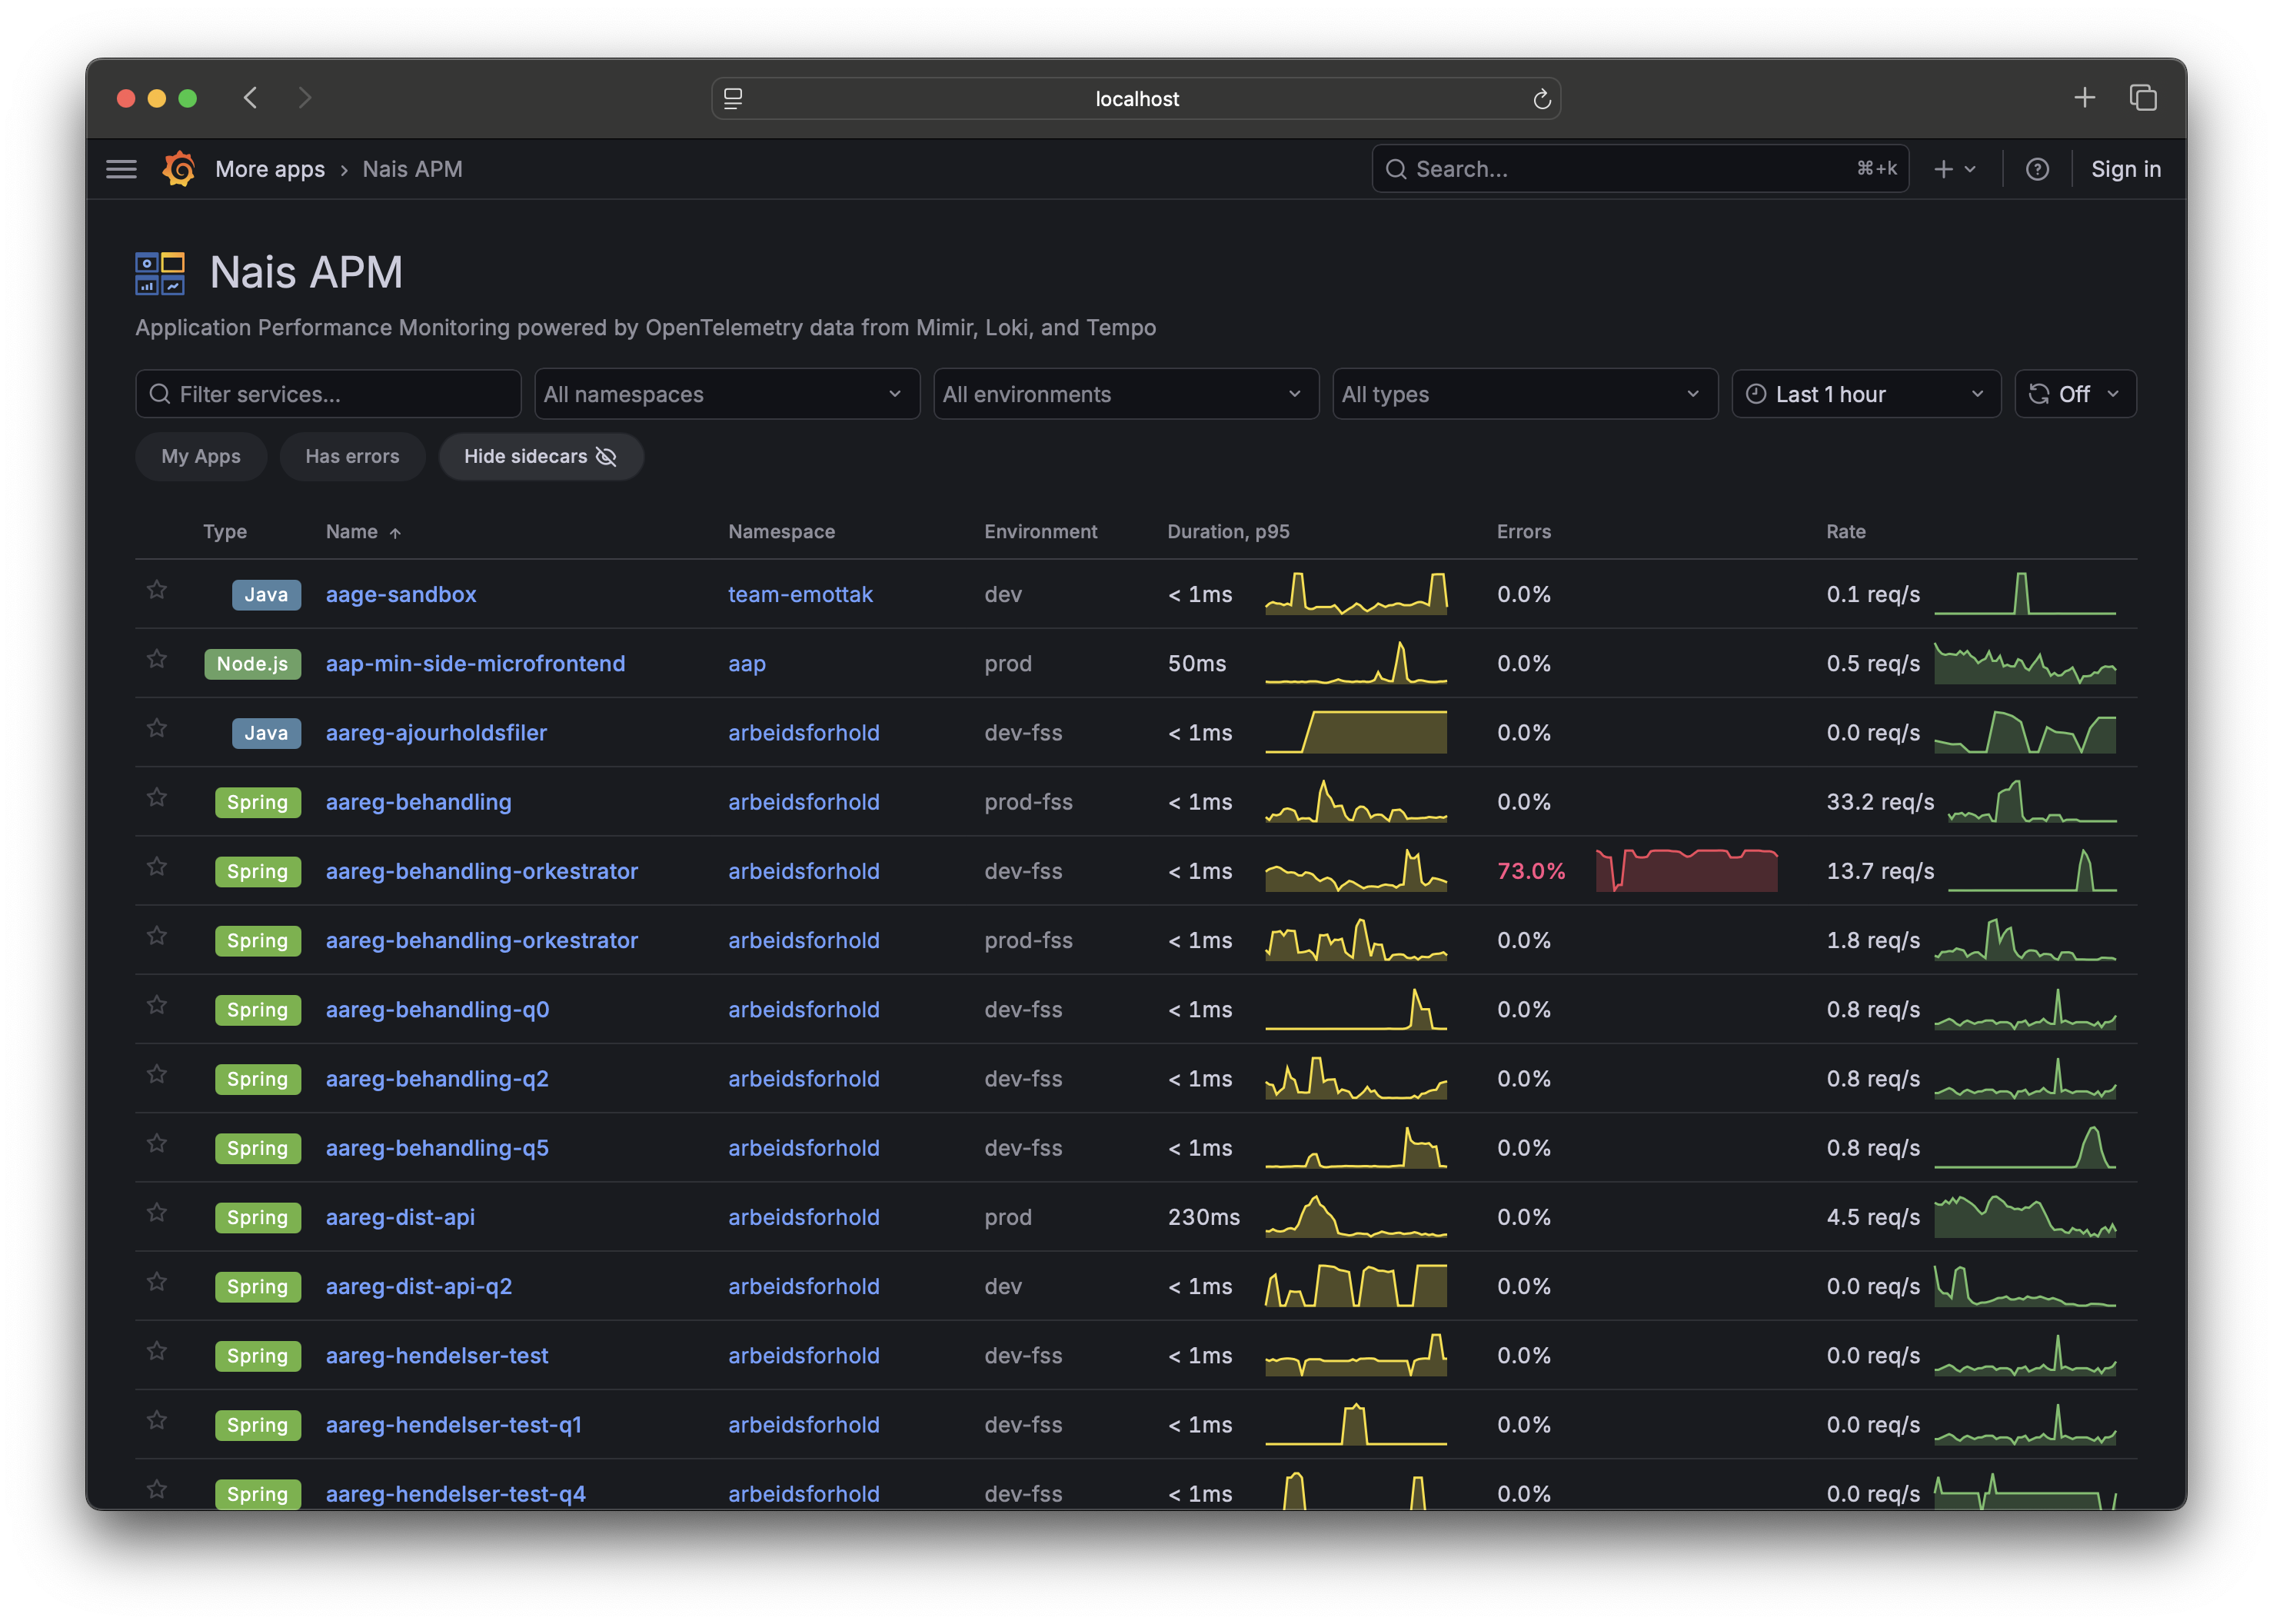
1. Find your service 
Open the Nais APM service inventory. You get a searchable list of every service the platform sees telemetry for. Search is fuzzy, so a partial name is enough.
Click your service to open its detail page. The tabs across the top follow the path from symptom to cause:
Overview · Issues · Alerts · Backend · Frontend · Database · Dependencies · Traces · Logs · (Profiling)
Overview, Alerts, Backend, Frontend, and Database are always there — if there's no data yet, they show an empty/setup state instead of disappearing. Issues, Traces, Logs, Dependencies, and Profiling appear only when the capability behind them is present: Issues/Traces/Logs need Loki and Tempo, Dependencies needs the service graph, and Profiling shows up only for teams that have a profiling datasource — most won't.
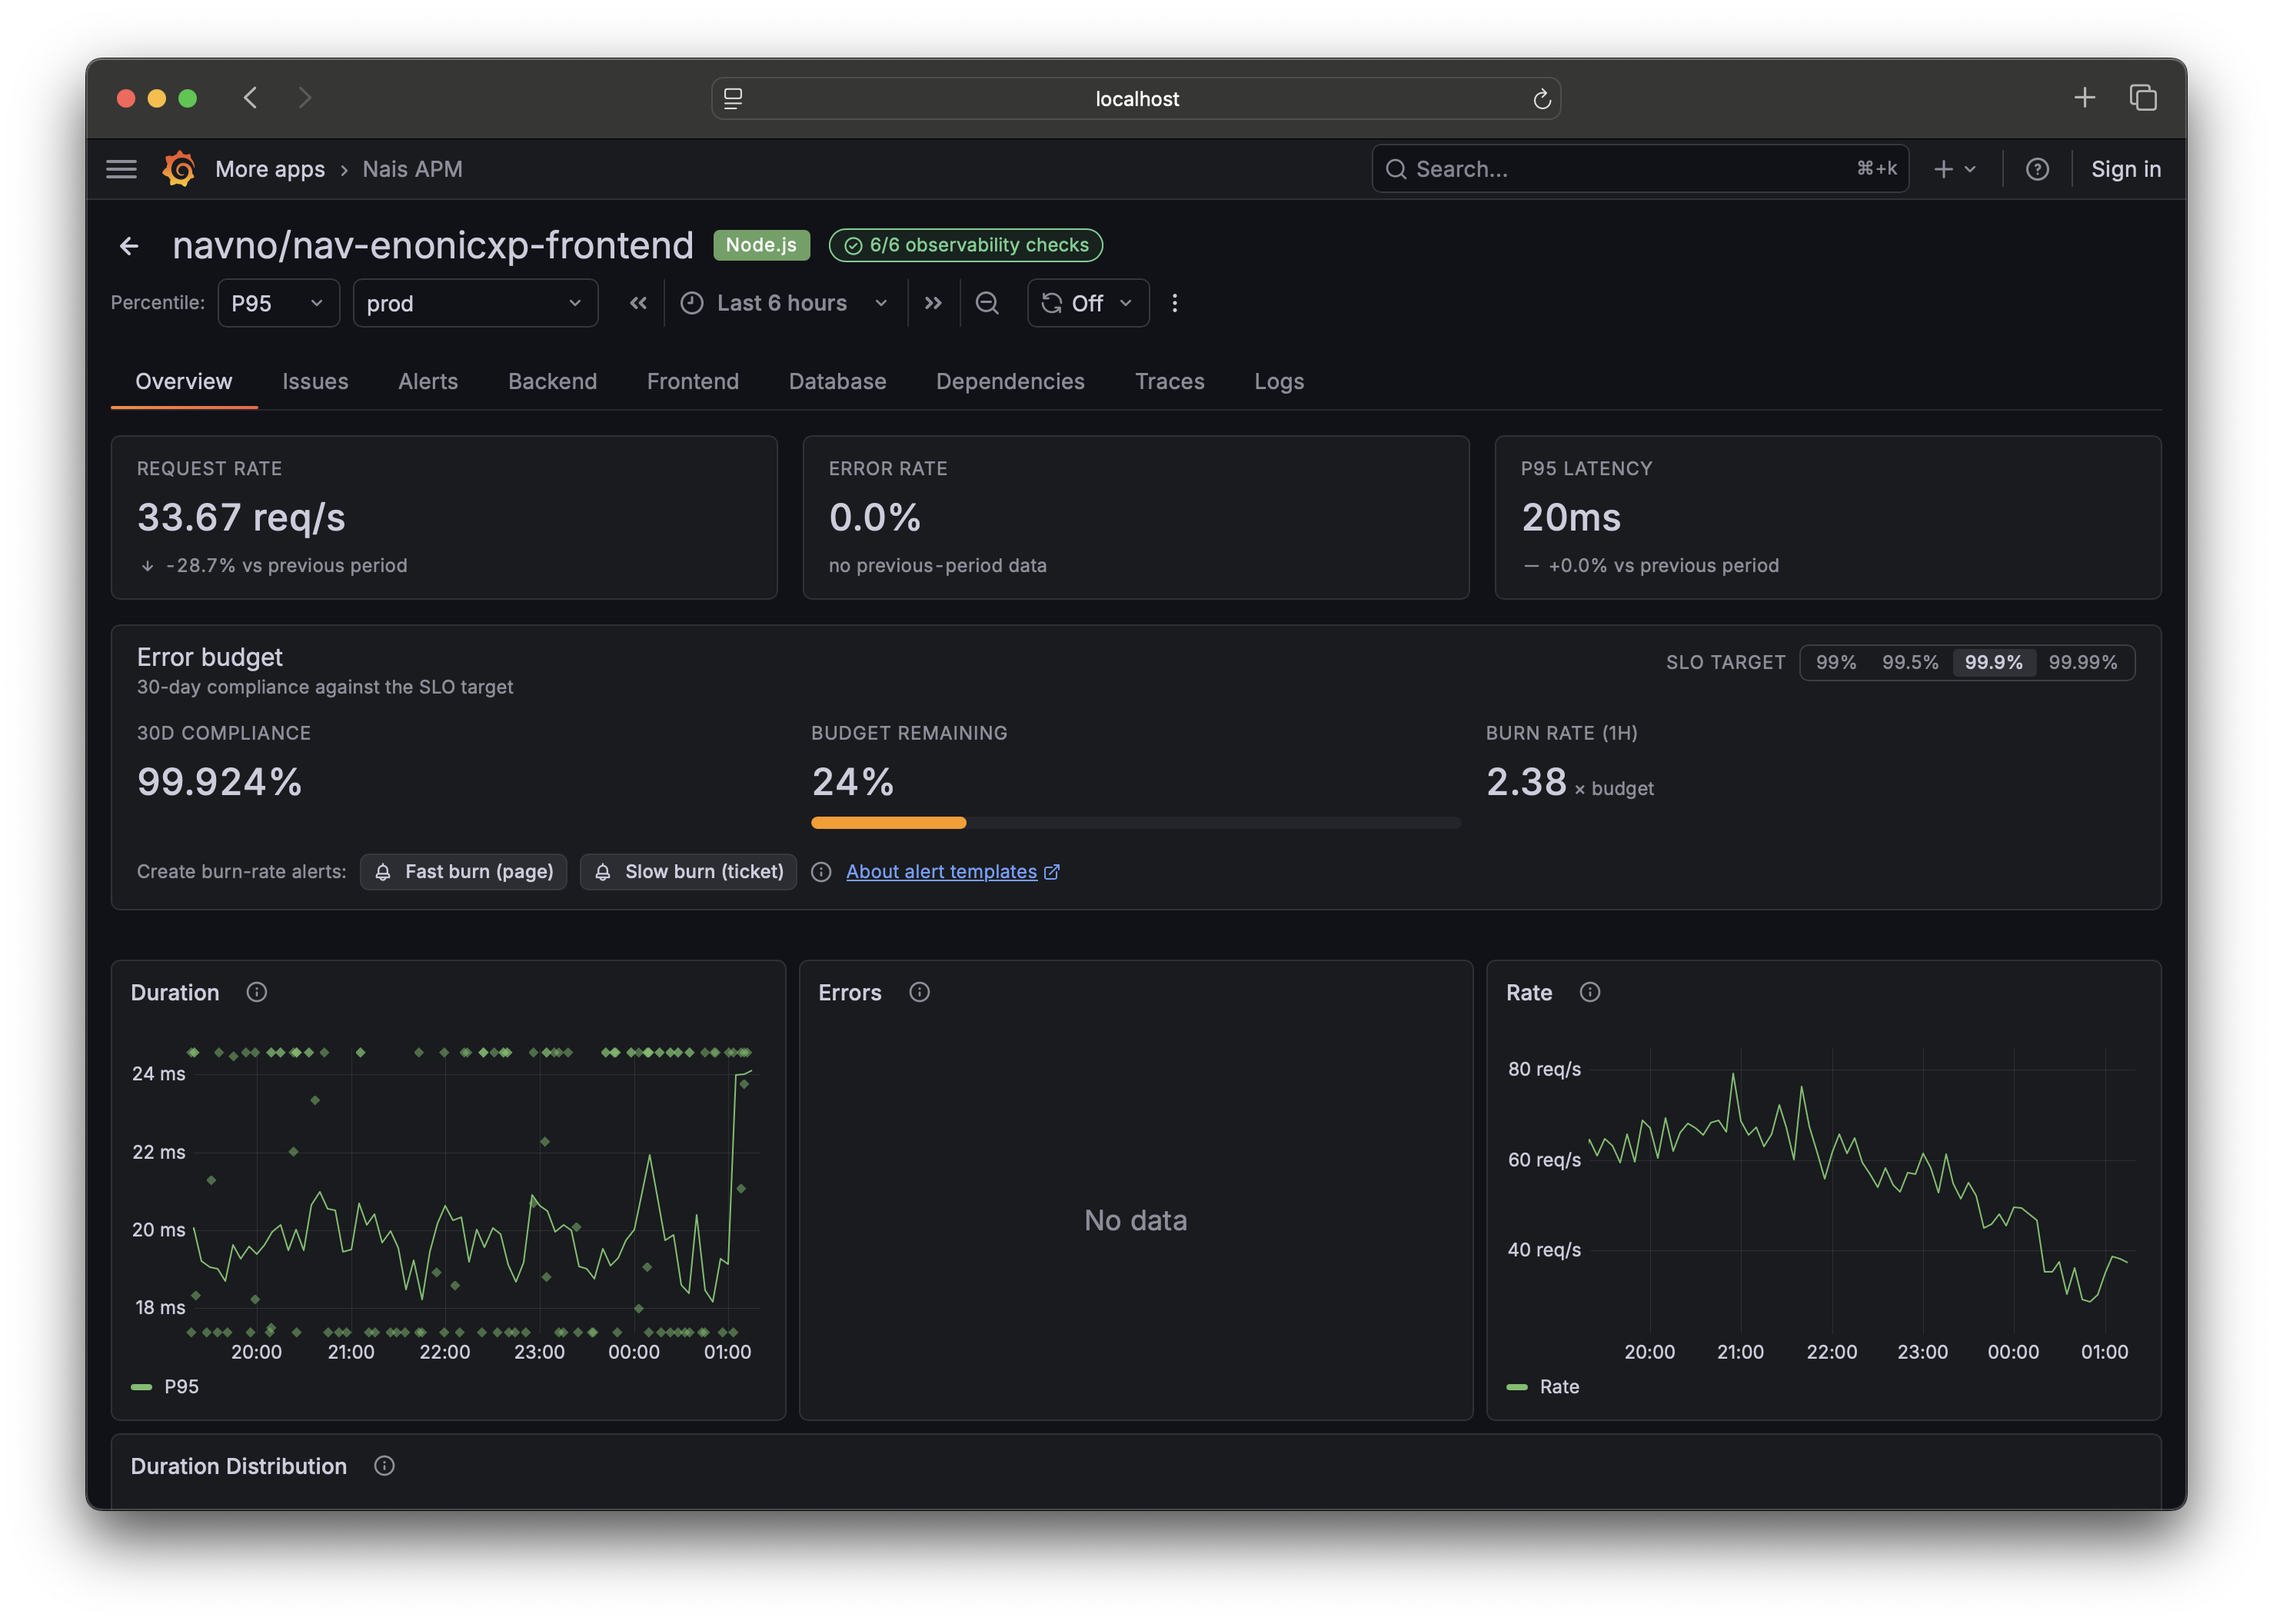
2. Read the health overview 
The Overview tab opens with a health header: the RED signals as big numbers.
- Rate — requests per second.
- Errors — error ratio.
- Duration — latency.
Each number carries a delta against the previous period — for example, a red arrow if errors are up versus the same window before it. This is the "is this OK right now?" answer without reading a chart. Below the header, an attention section calls out degraded operations and dependencies, and deploy markers on the charts show which release moved the line.
Custom application metrics, if your app exposes any, are collapsed at the bottom of Overview so they don't crowd the health signal.
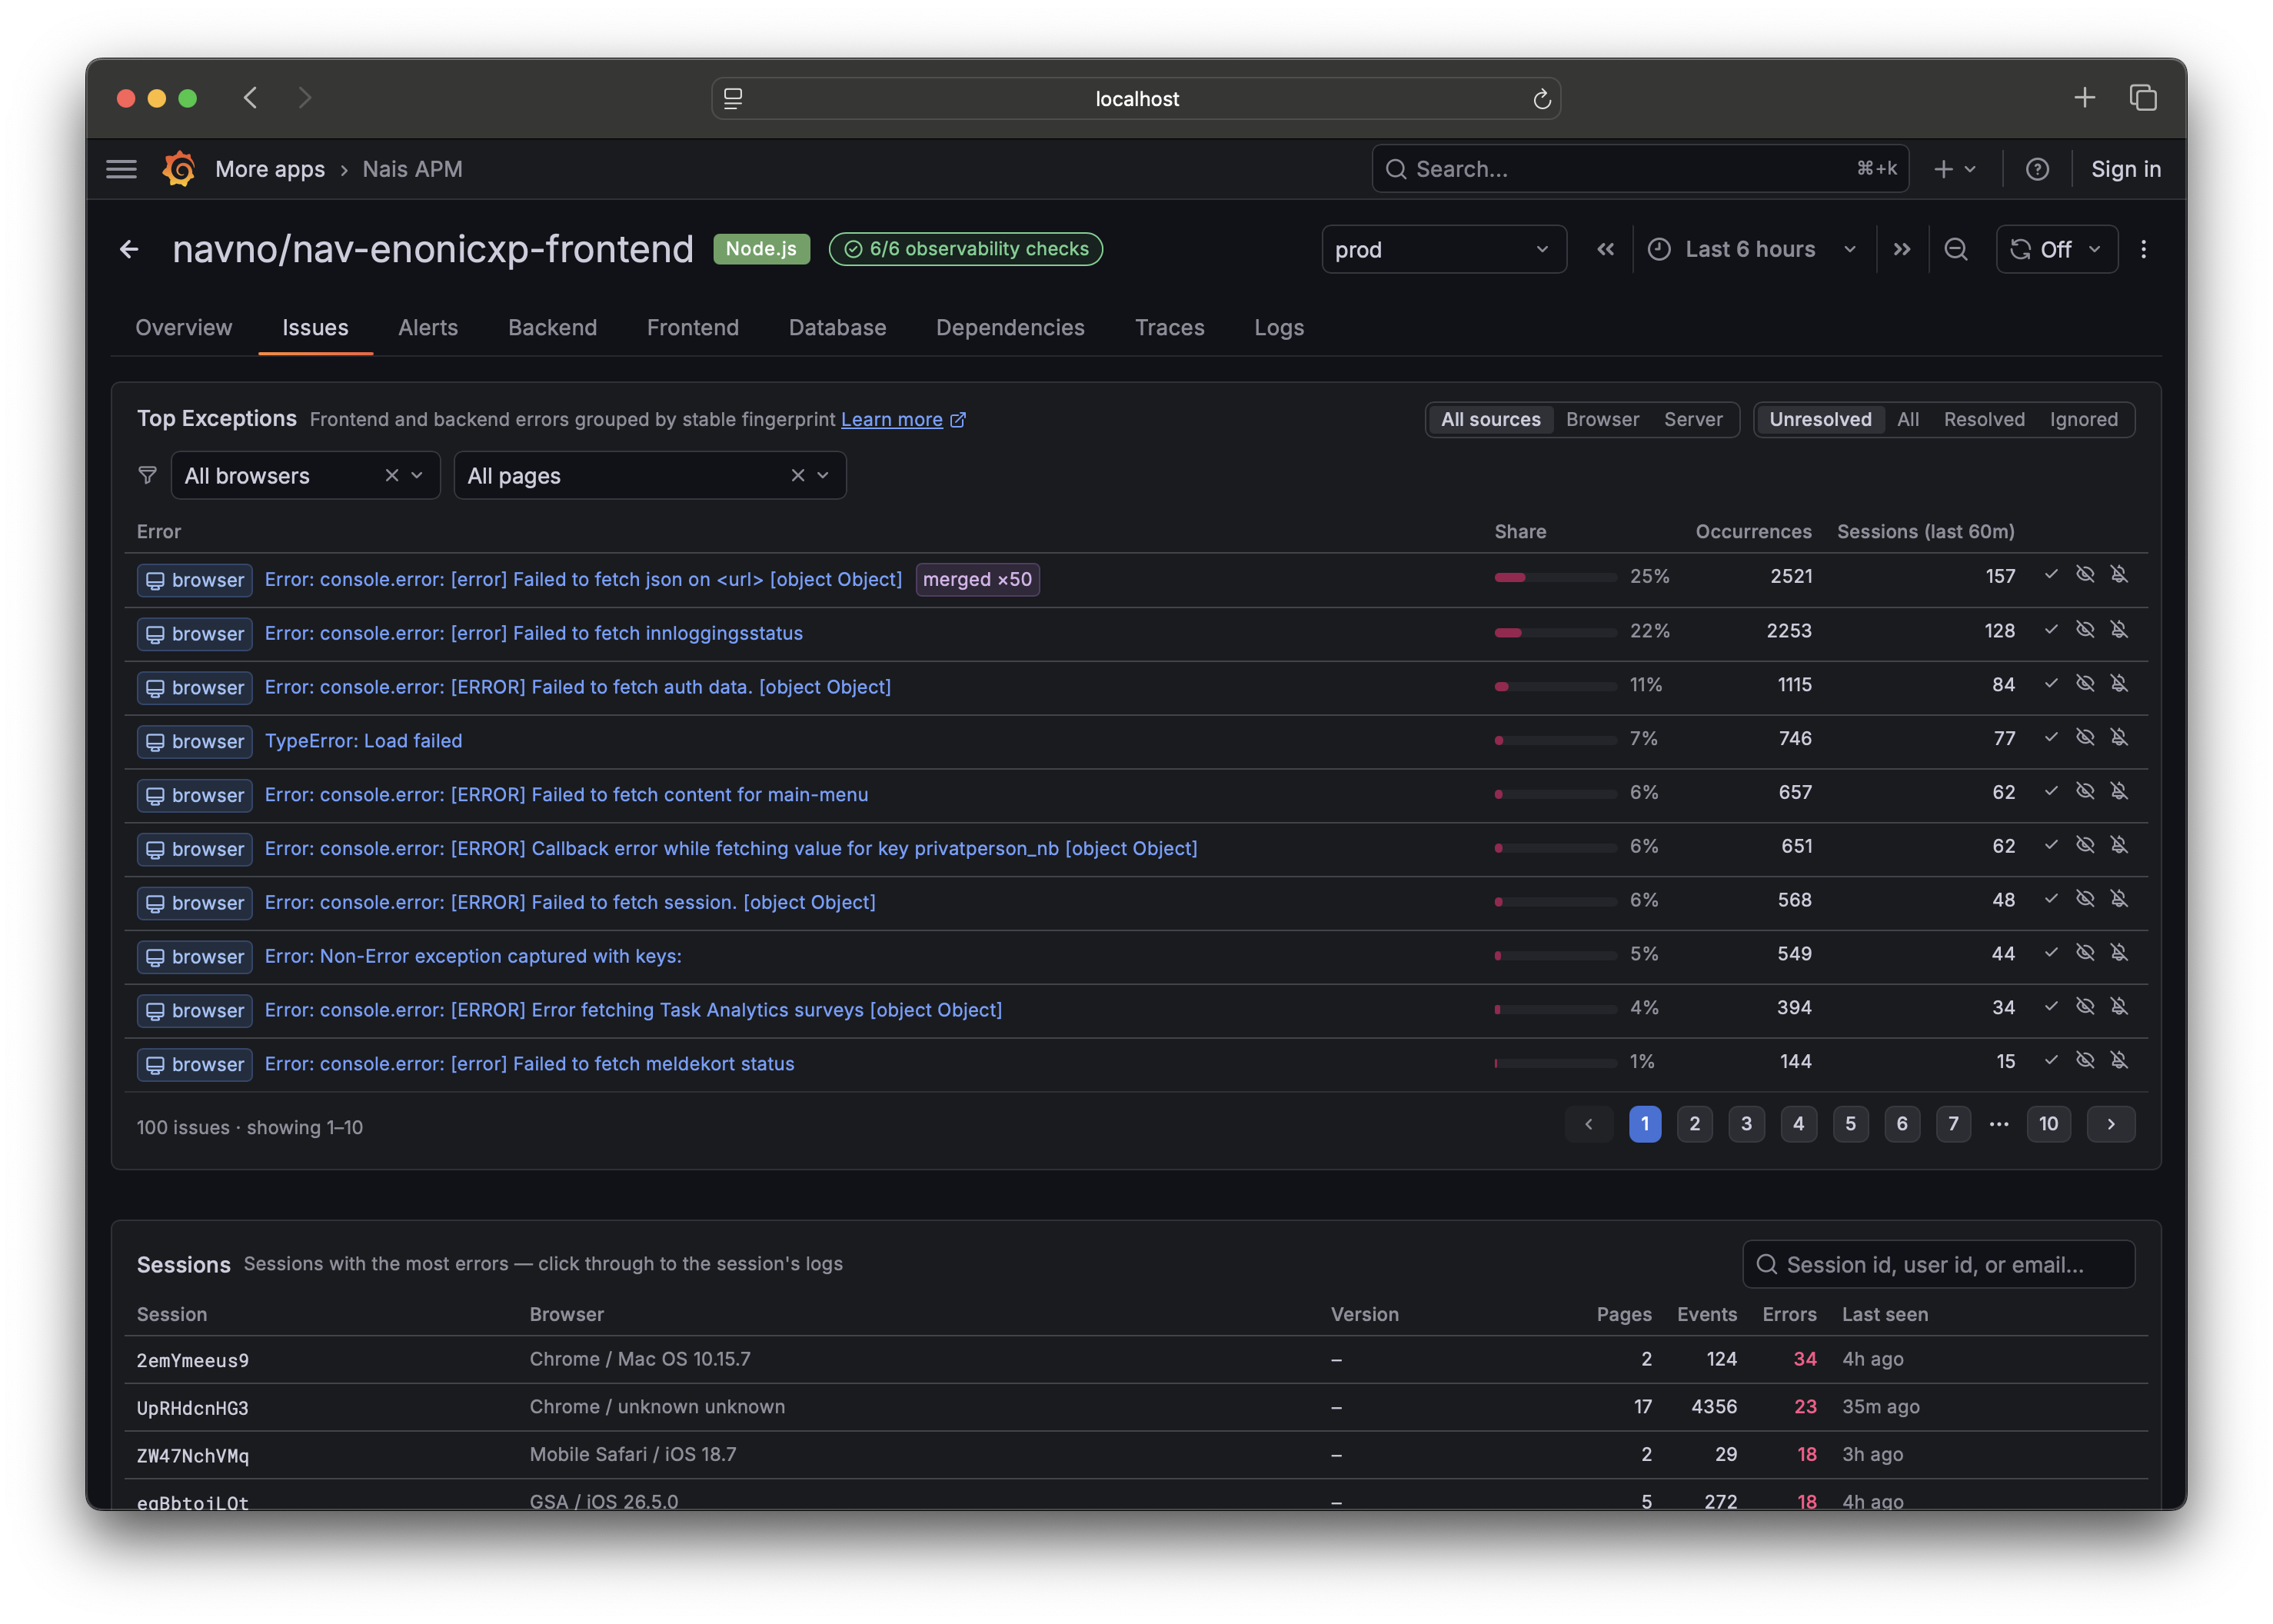
3. Check the Issues tab 
The Issues tab is the errors list — browser and backend errors side by side, each grouped into a single issue. By default it shows unresolved issues, sorted so anything Regressed (resolved before, happening again) floats to the top.
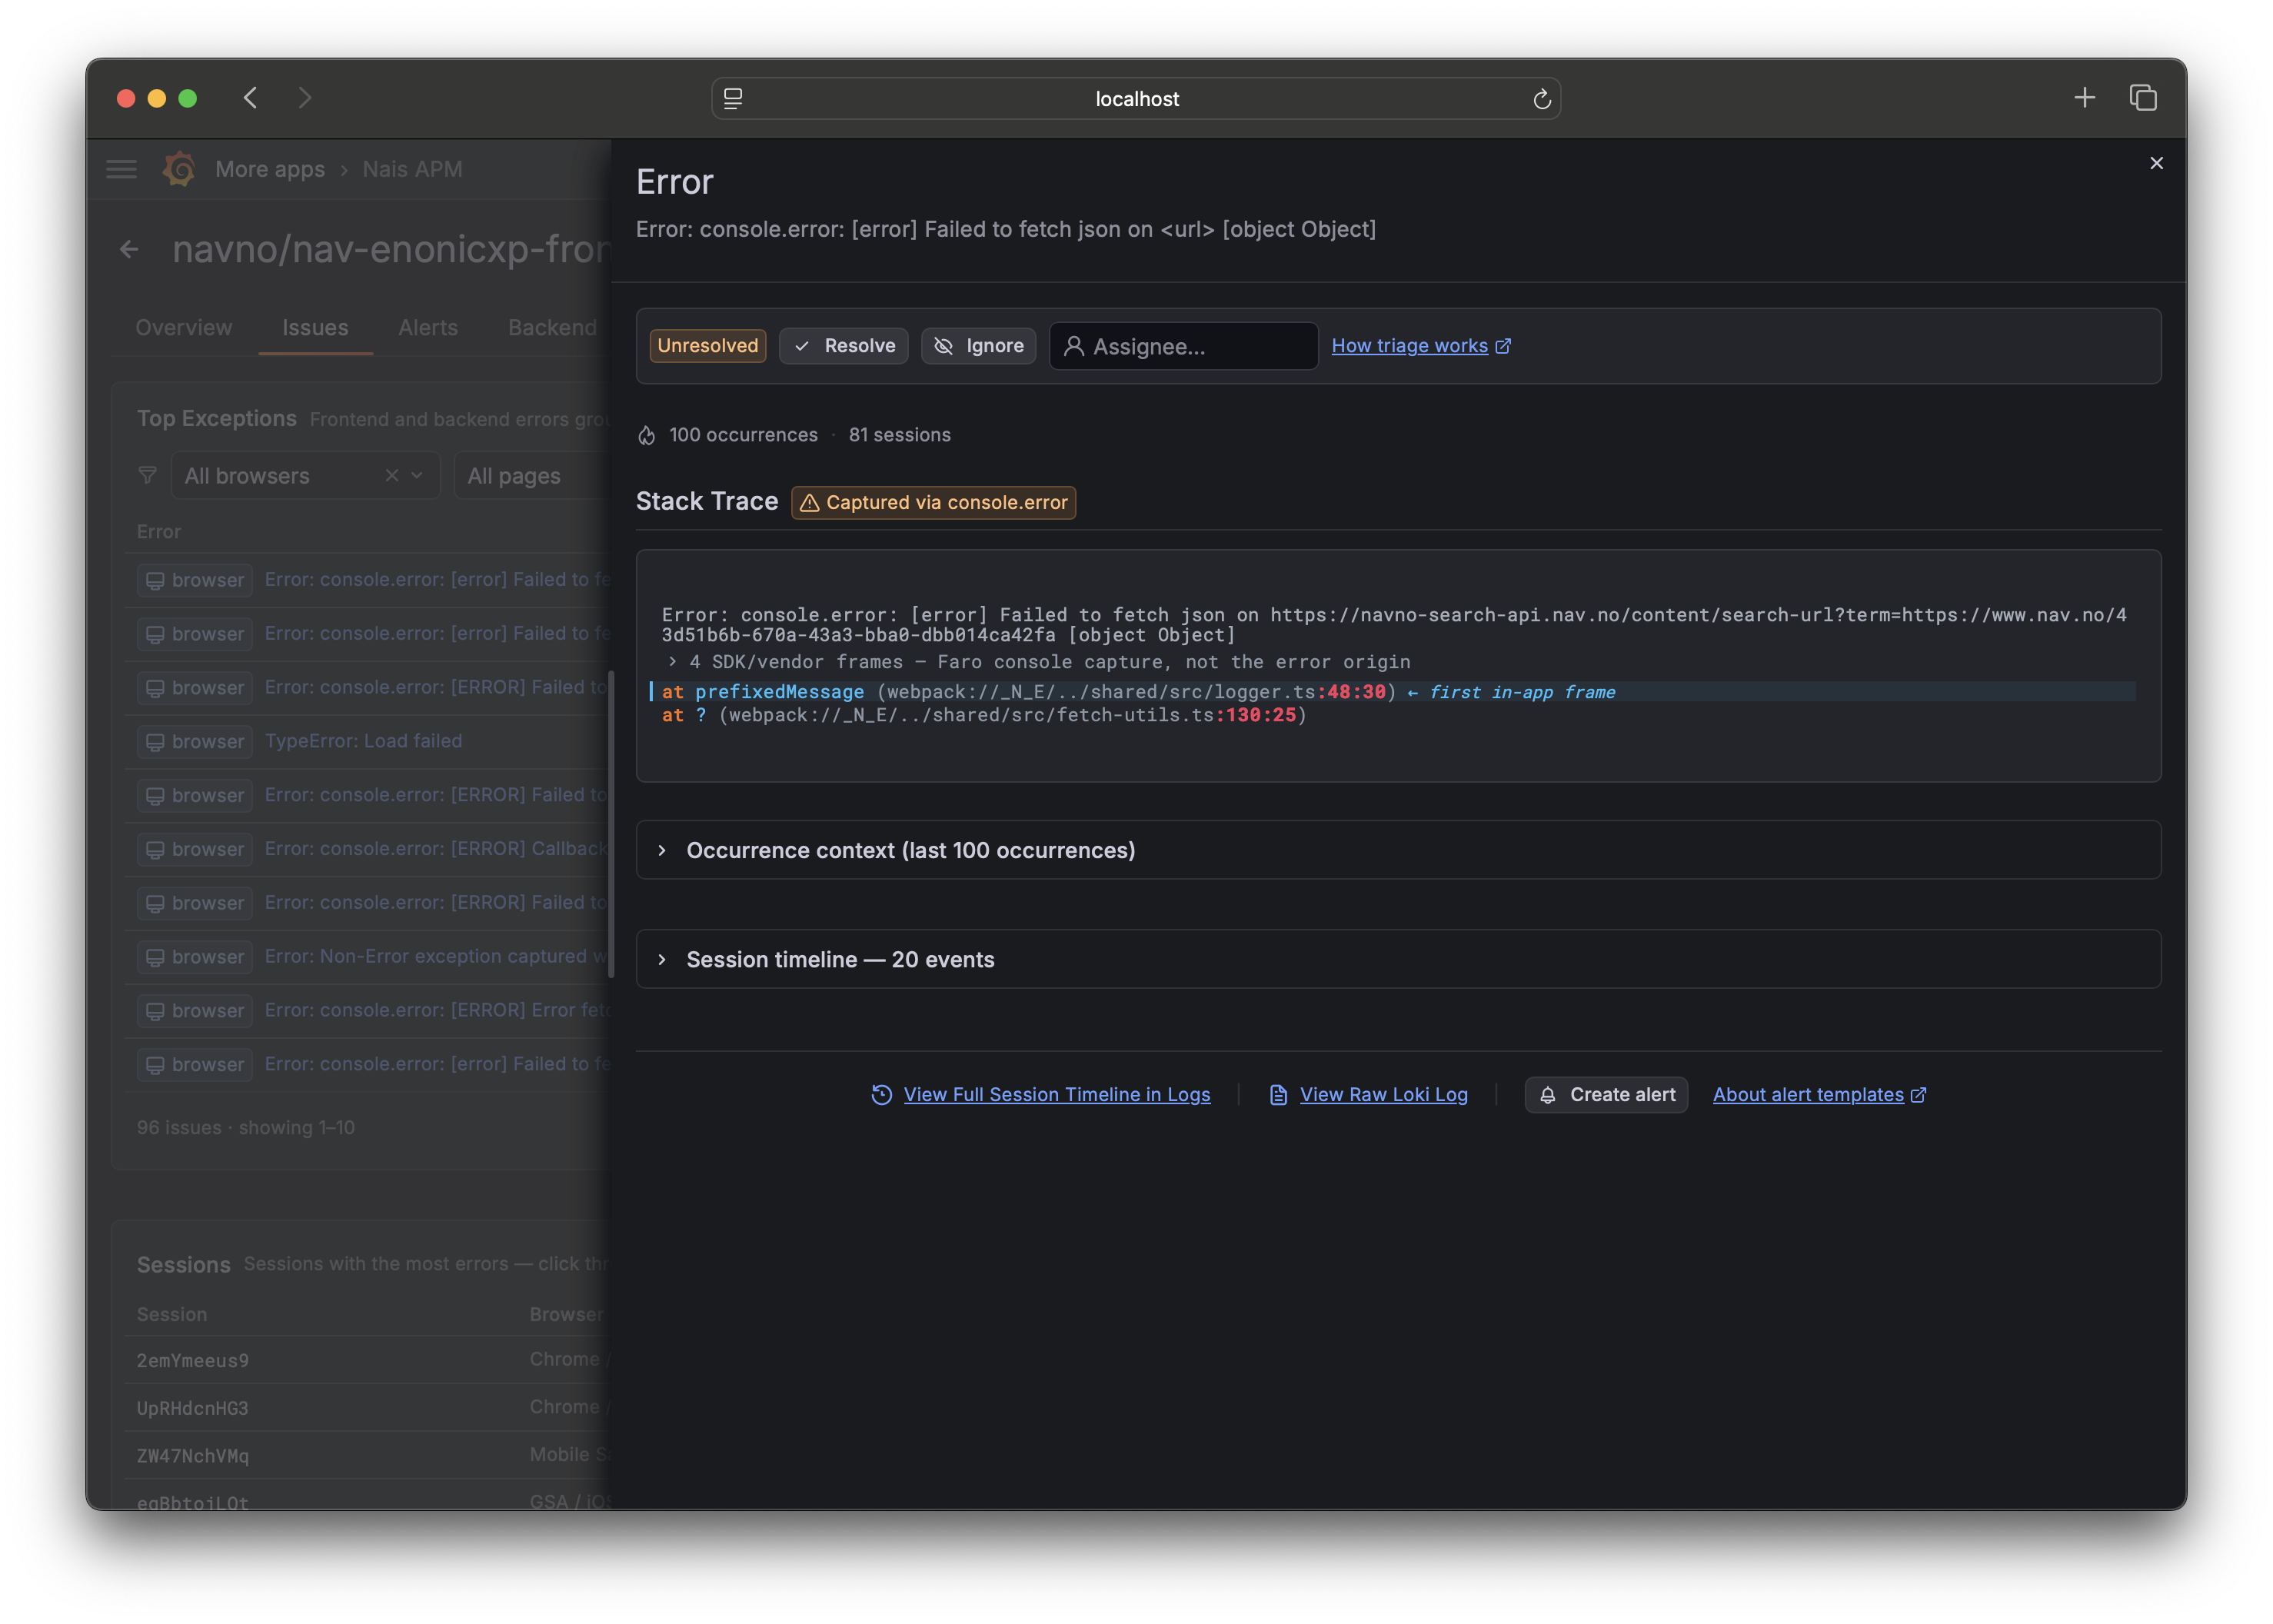
Click a row to open the issue drawer: the stack trace with your own code highlighted, impact (how many users, which versions, which endpoints), and a link to a representative trace. From here you can resolve, ignore, or assign the issue — see Triage an issue.
Below the list, the Versions panel answers "did this start with today's release?" and the Sessions panel lets you search by user or session.
4. Look at Backend, Database, and Frontend 
- Backend — RED metrics per operation at the top (which HTTP route is slow or erroring), and process/runtime internals (JVM heap, threads, and similar) below, collapsed by default. These used to be two separate Endpoints and Runtime tabs; they're now one place. Old
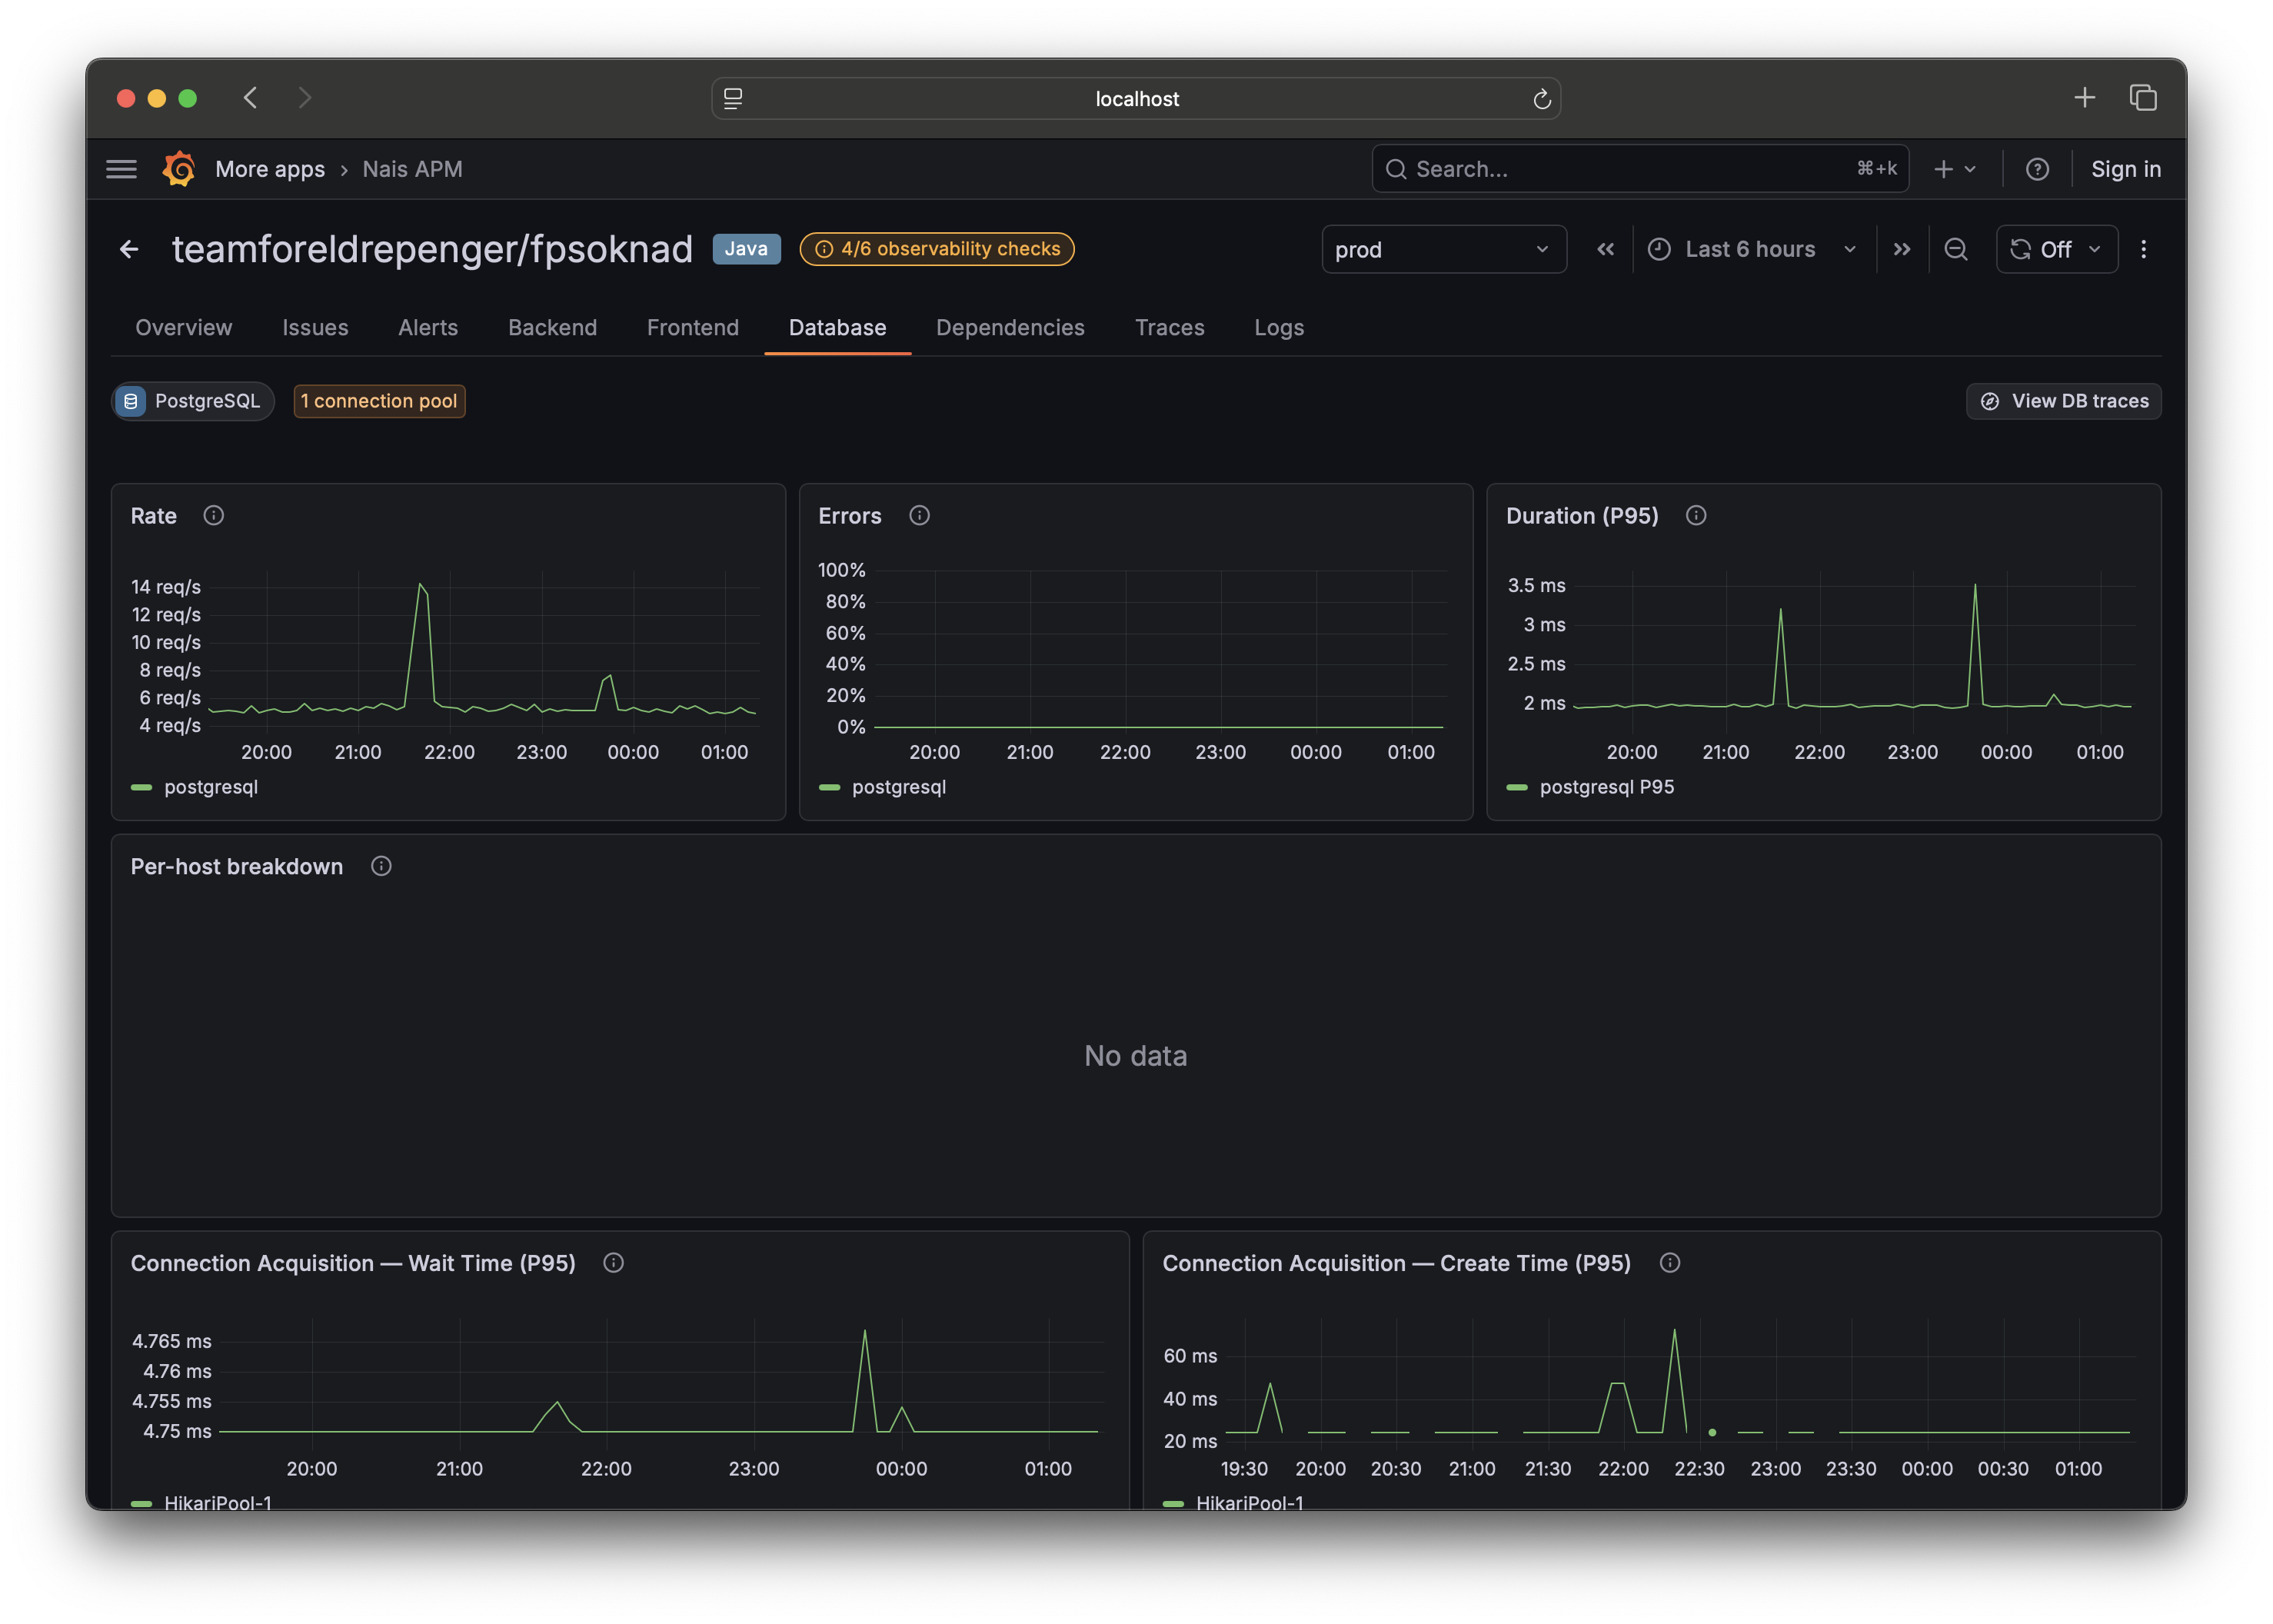
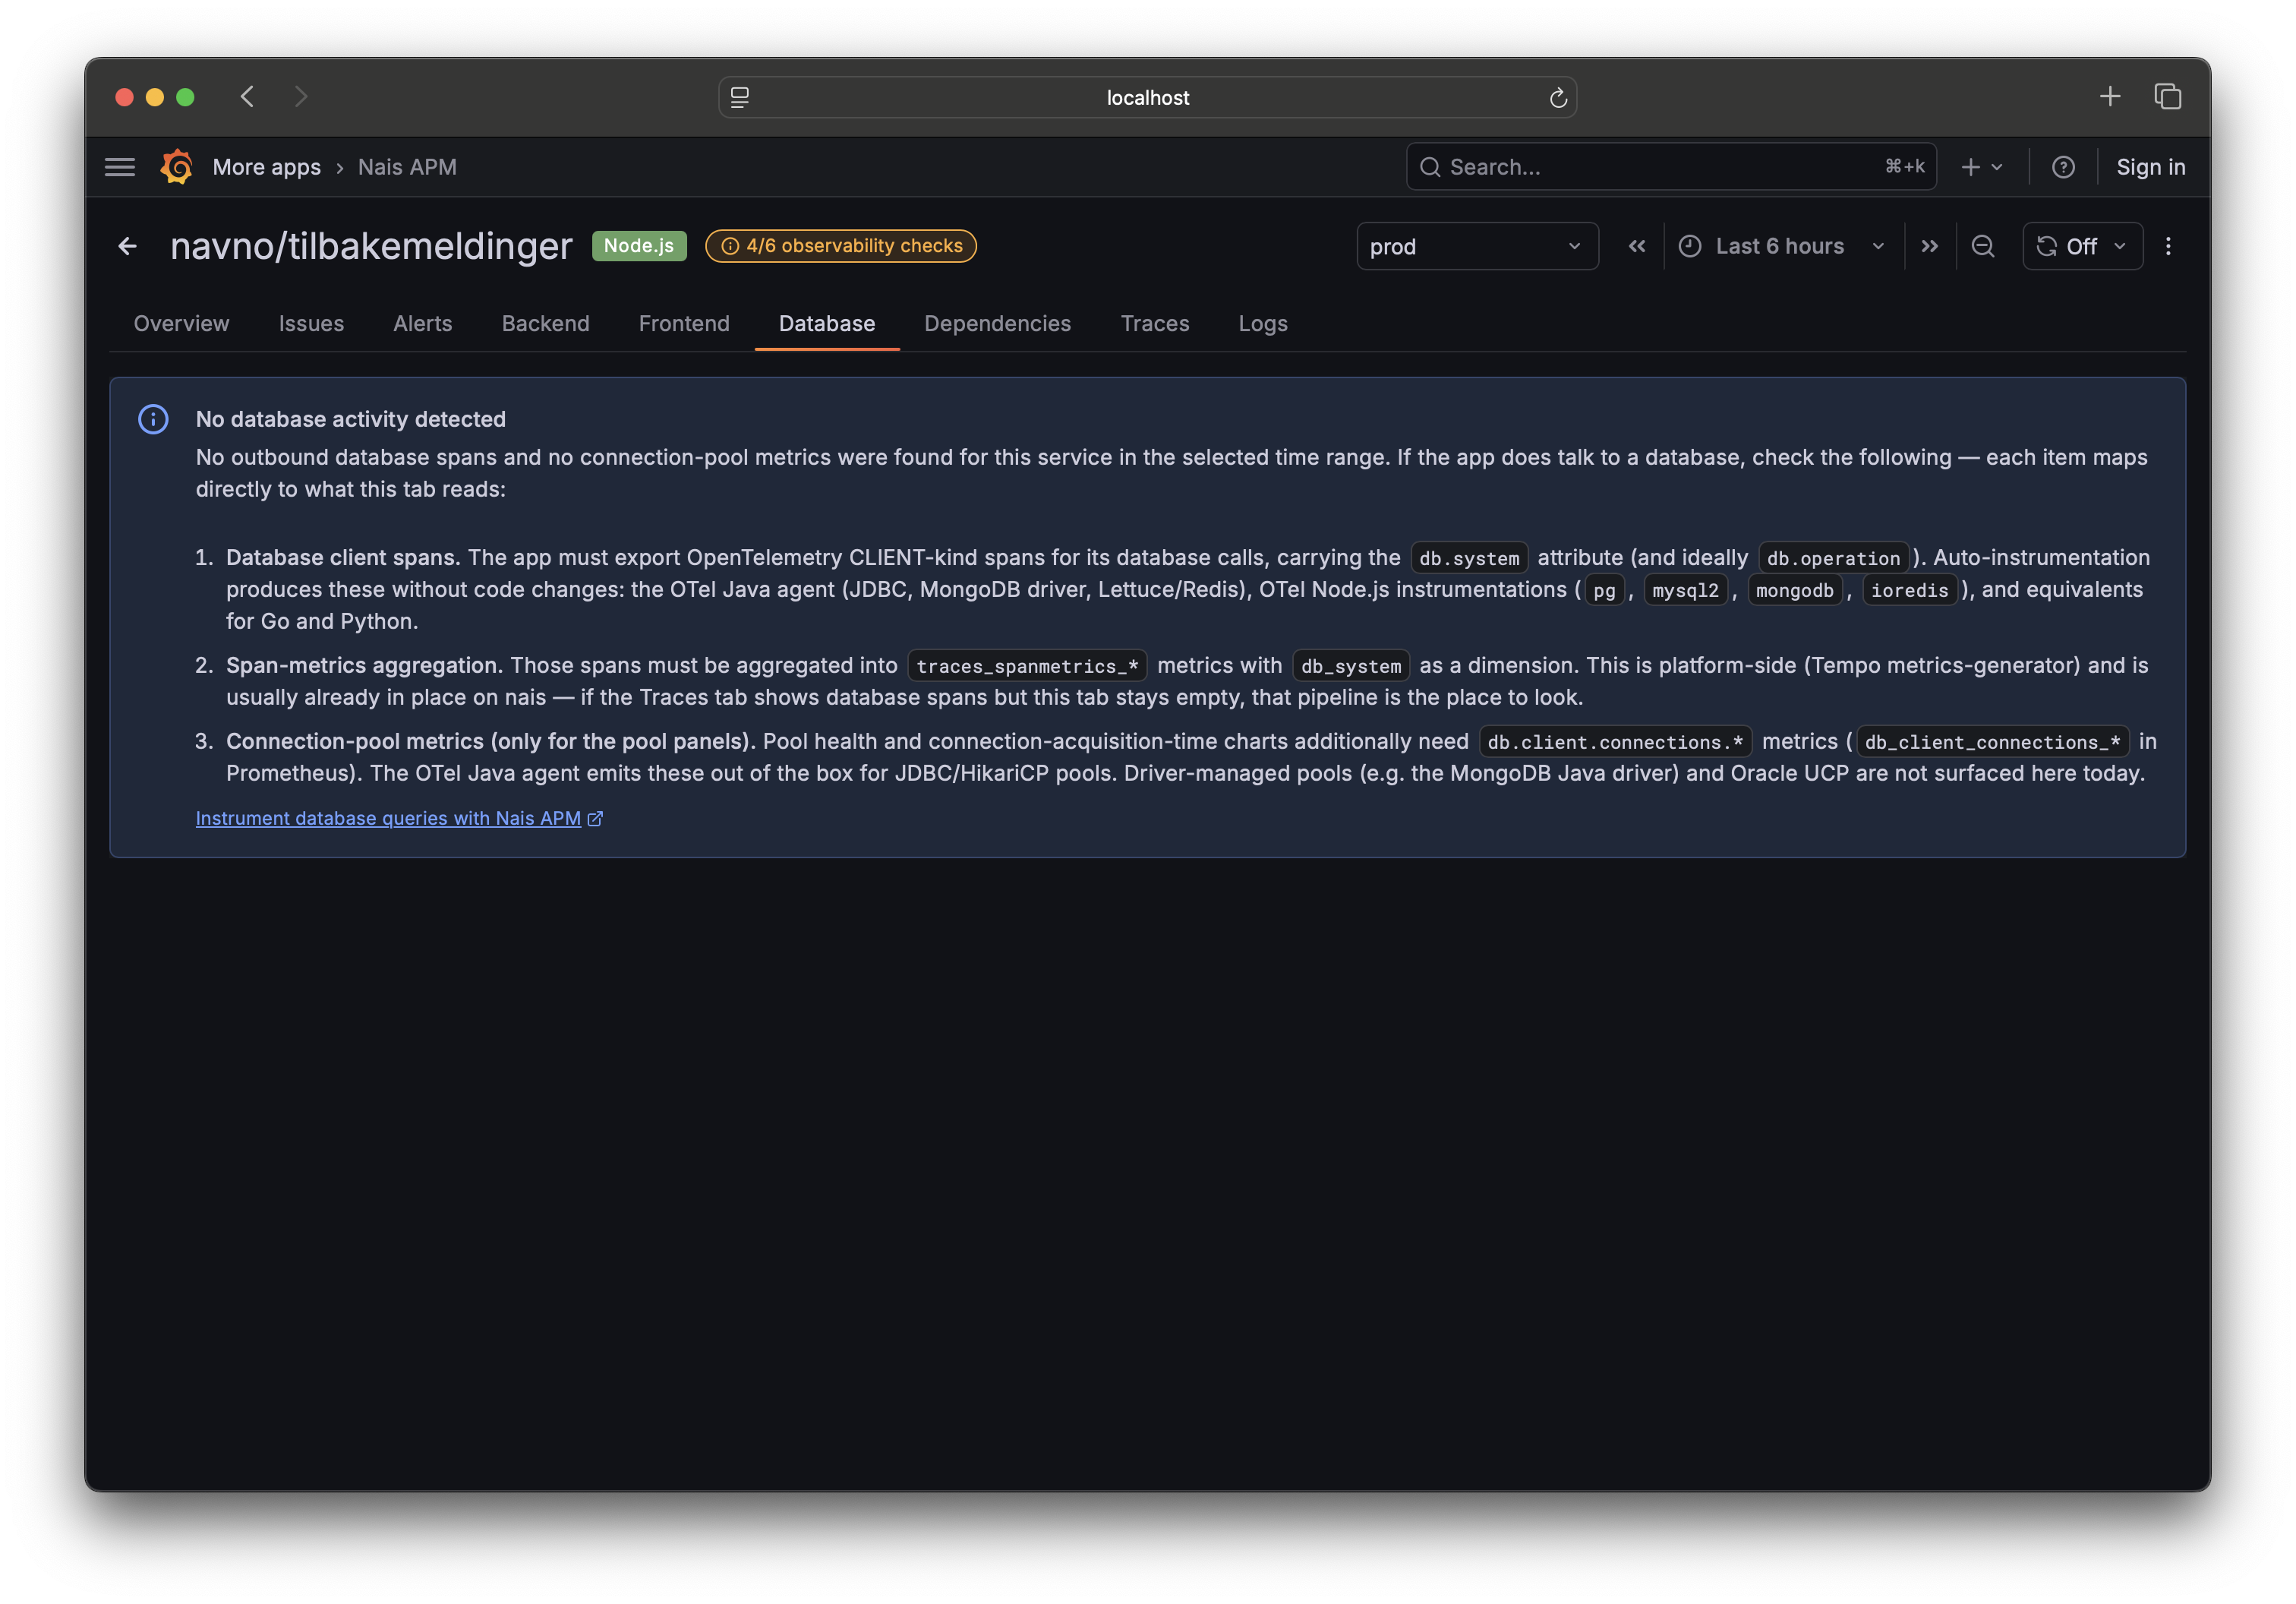
tab=serverandtab=runtimelinks still open here. - Database — query analytics (rate, errors, latency per operation) built from your database spans, plus connection-pool health. If it's empty, your app may need database instrumentation.
- Frontend — Core Web Vitals, pageloads, sessions, per-page performance, and a browser breakdown, plus web-vitals attribution (what's driving LCP, INP, and CLS). This tab lights up for apps using Grafana Faro or
@nais/apm.
5. Drill into Traces and Logs 
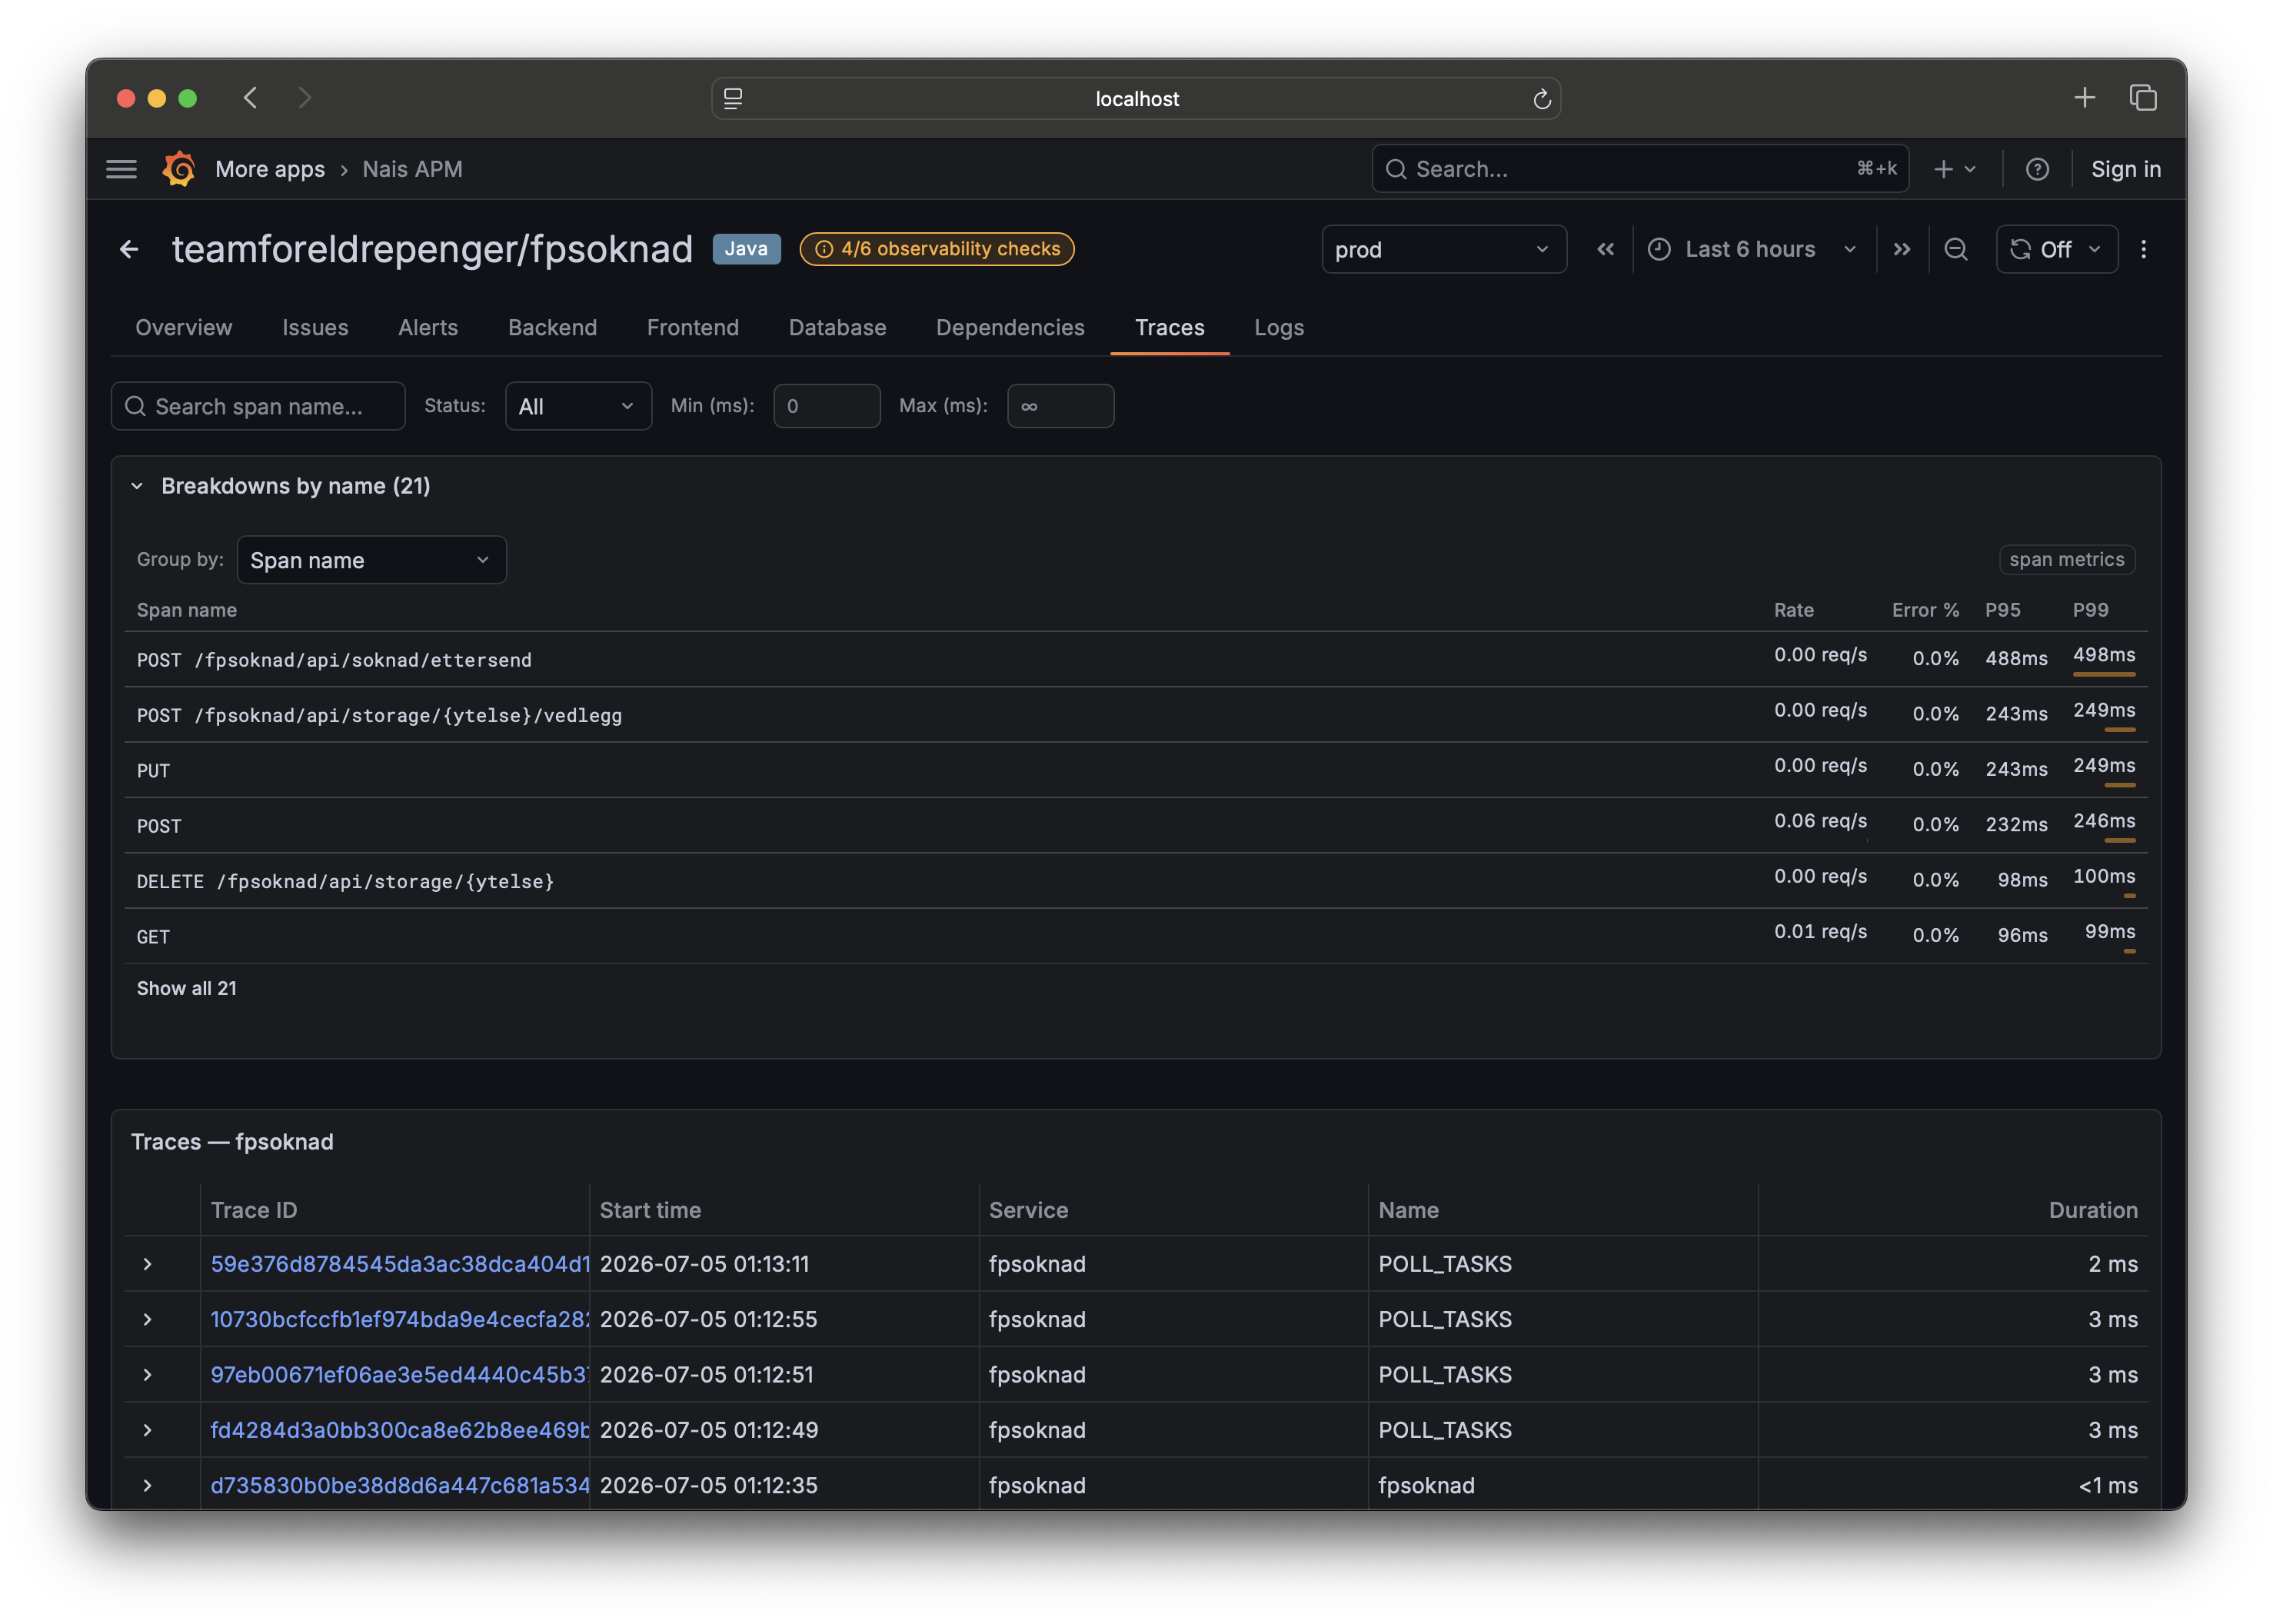
- Traces — search your service's traces. Trace breakdowns group latency and errors by attribute, so you can see which tag explains the p99.
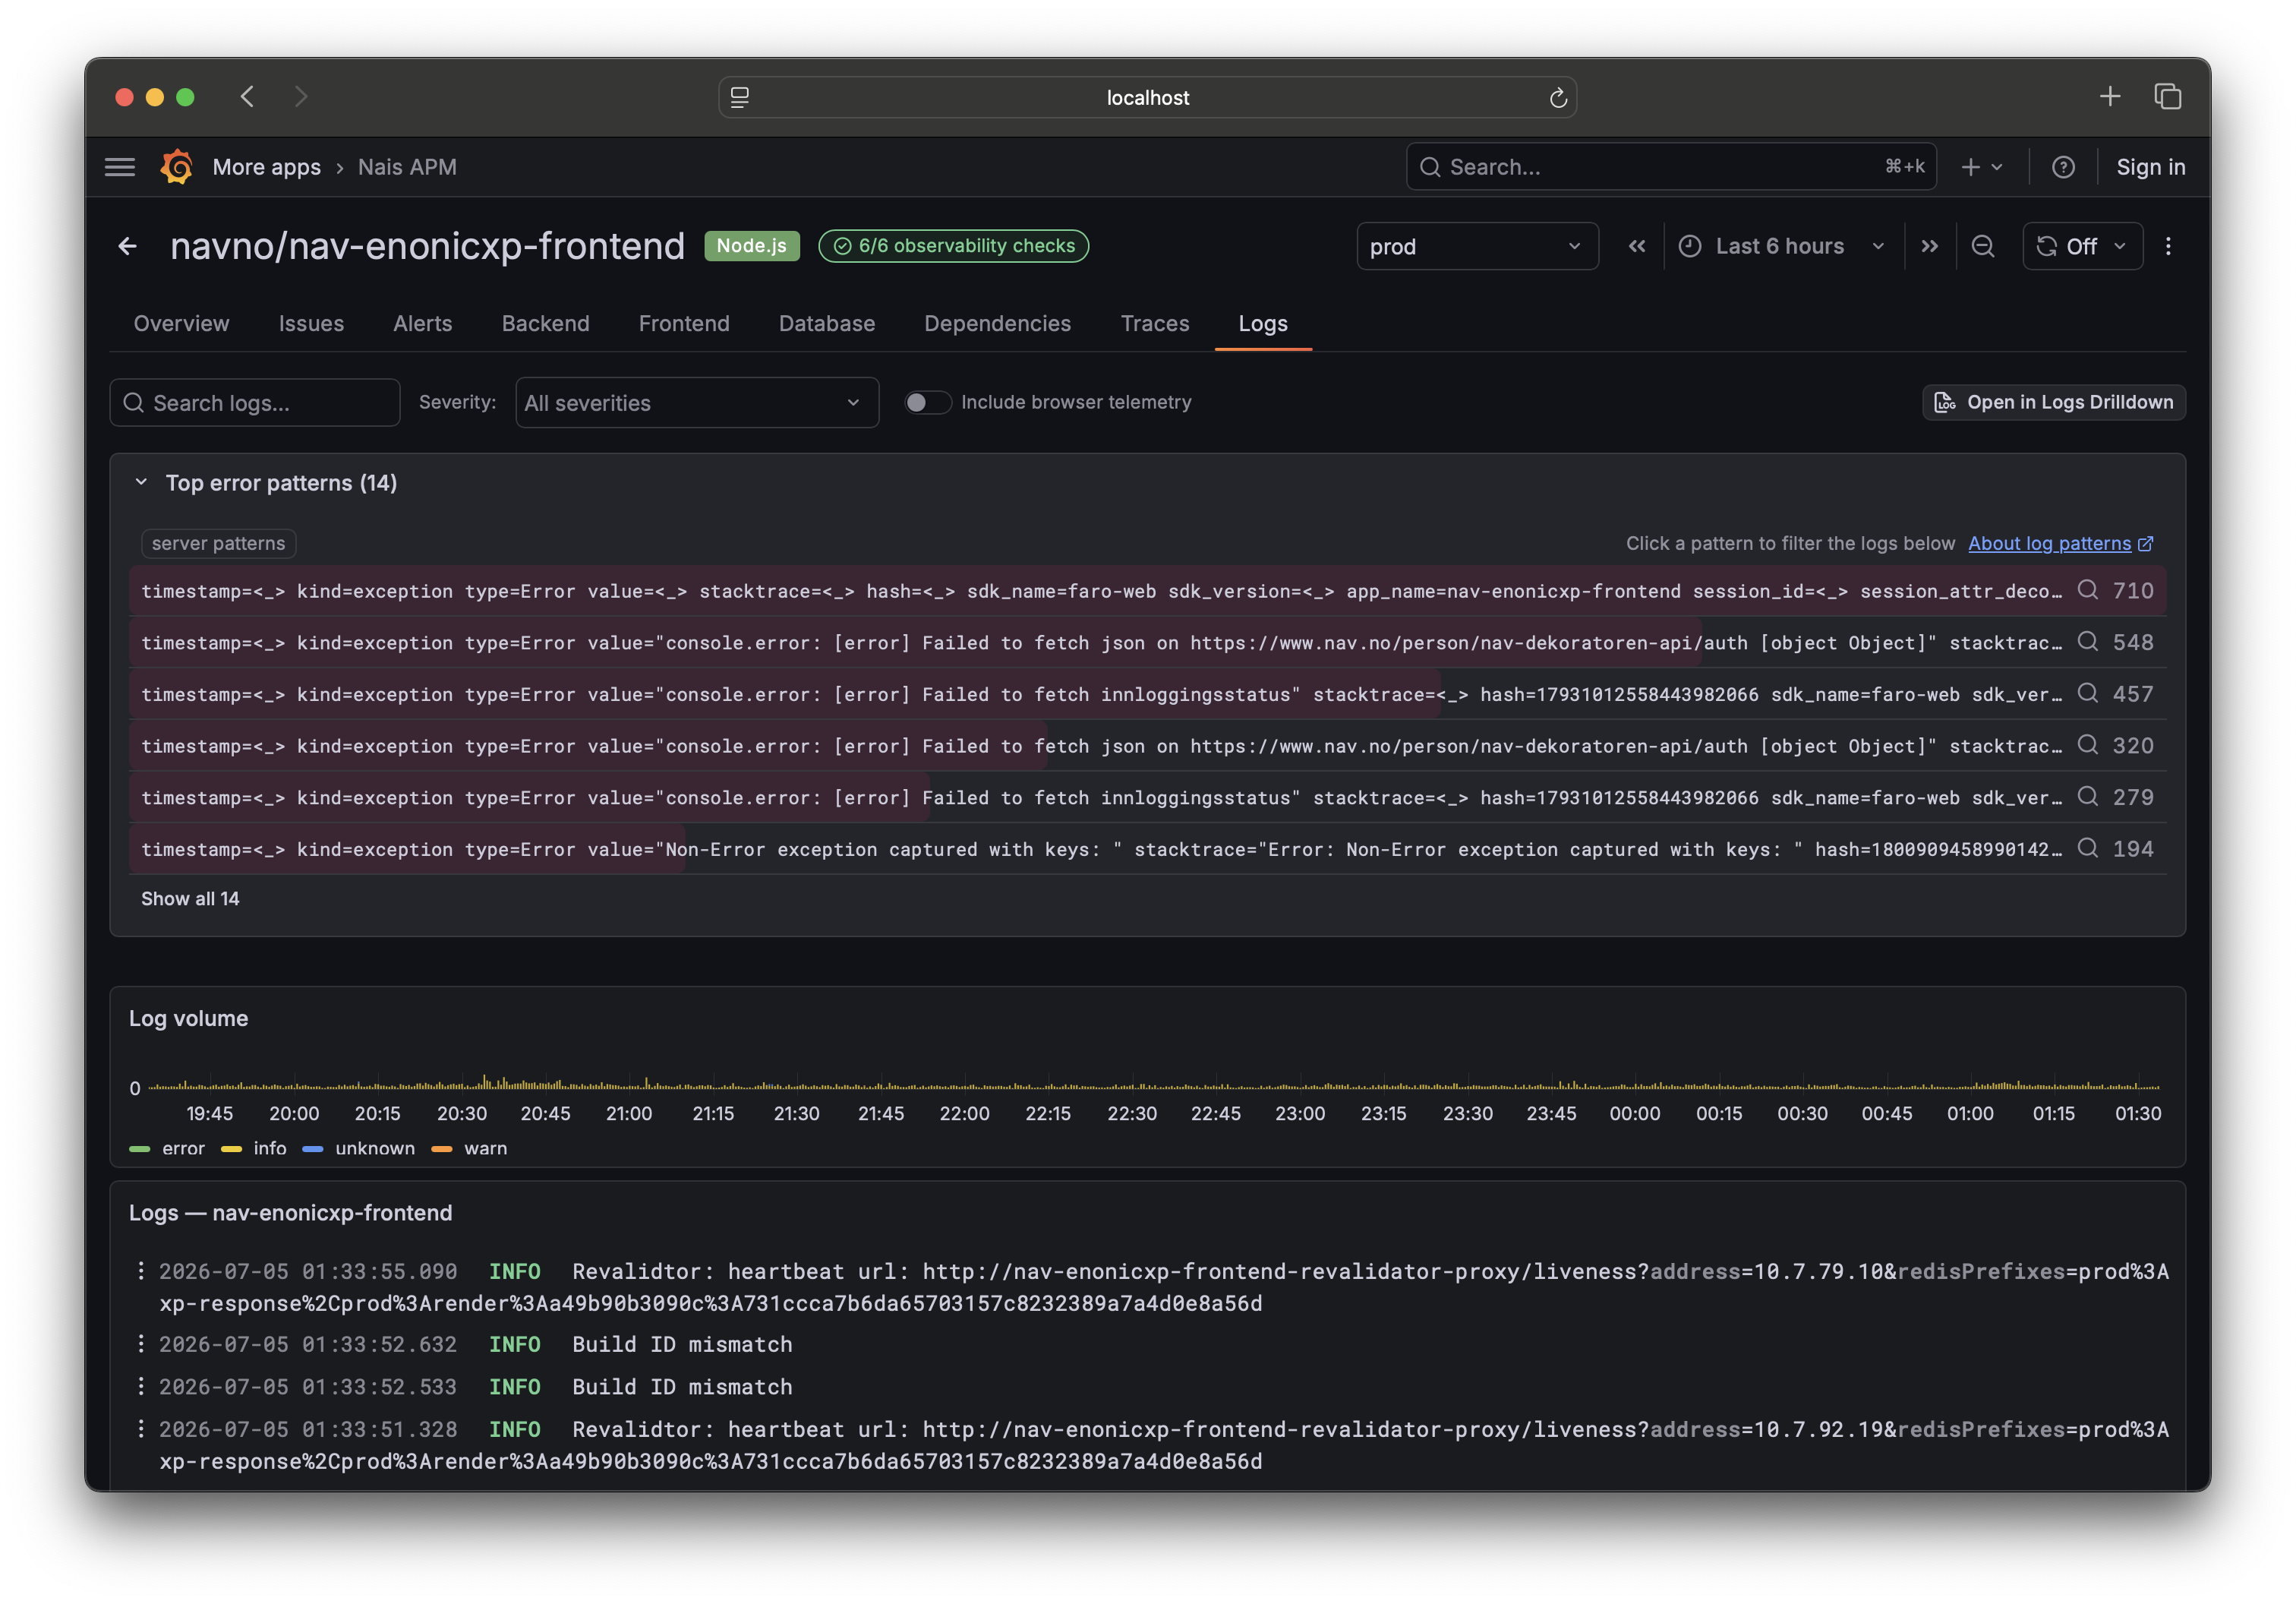
- Logs — search structured logs. Log patterns collapse thousands of log lines into a handful of templates so you can spot a new error pattern during an incident — see Use log patterns during an incident.
Both tabs open with the breakdown (Traces) or patterns (Logs) panel collapsed above the list — expand it when you want to slice the data, or work straight from the list below.
6. Use the shared time picker 
The time picker in the page header controls every tab at once. When you
narrow it to the minutes around an incident, the health header, issues, traces,
and logs all follow. The range lives in the URL (from/to), so a link you
copy opens on exactly the window you were looking at.
Next steps 
- Add error tracking to a browser app: Track frontend errors with
@nais/apm. - Get notified when things break: Create alerts from templates.
- Understand the machinery: How Nais APM works.