Use log patterns during an incident 
During an incident, raw logs scroll faster than you can read. Log patterns group your service's log lines into a small set of templates — the variable parts (ids, timestamps, numbers) replaced with placeholders — so a million lines become a dozen patterns you can actually scan.
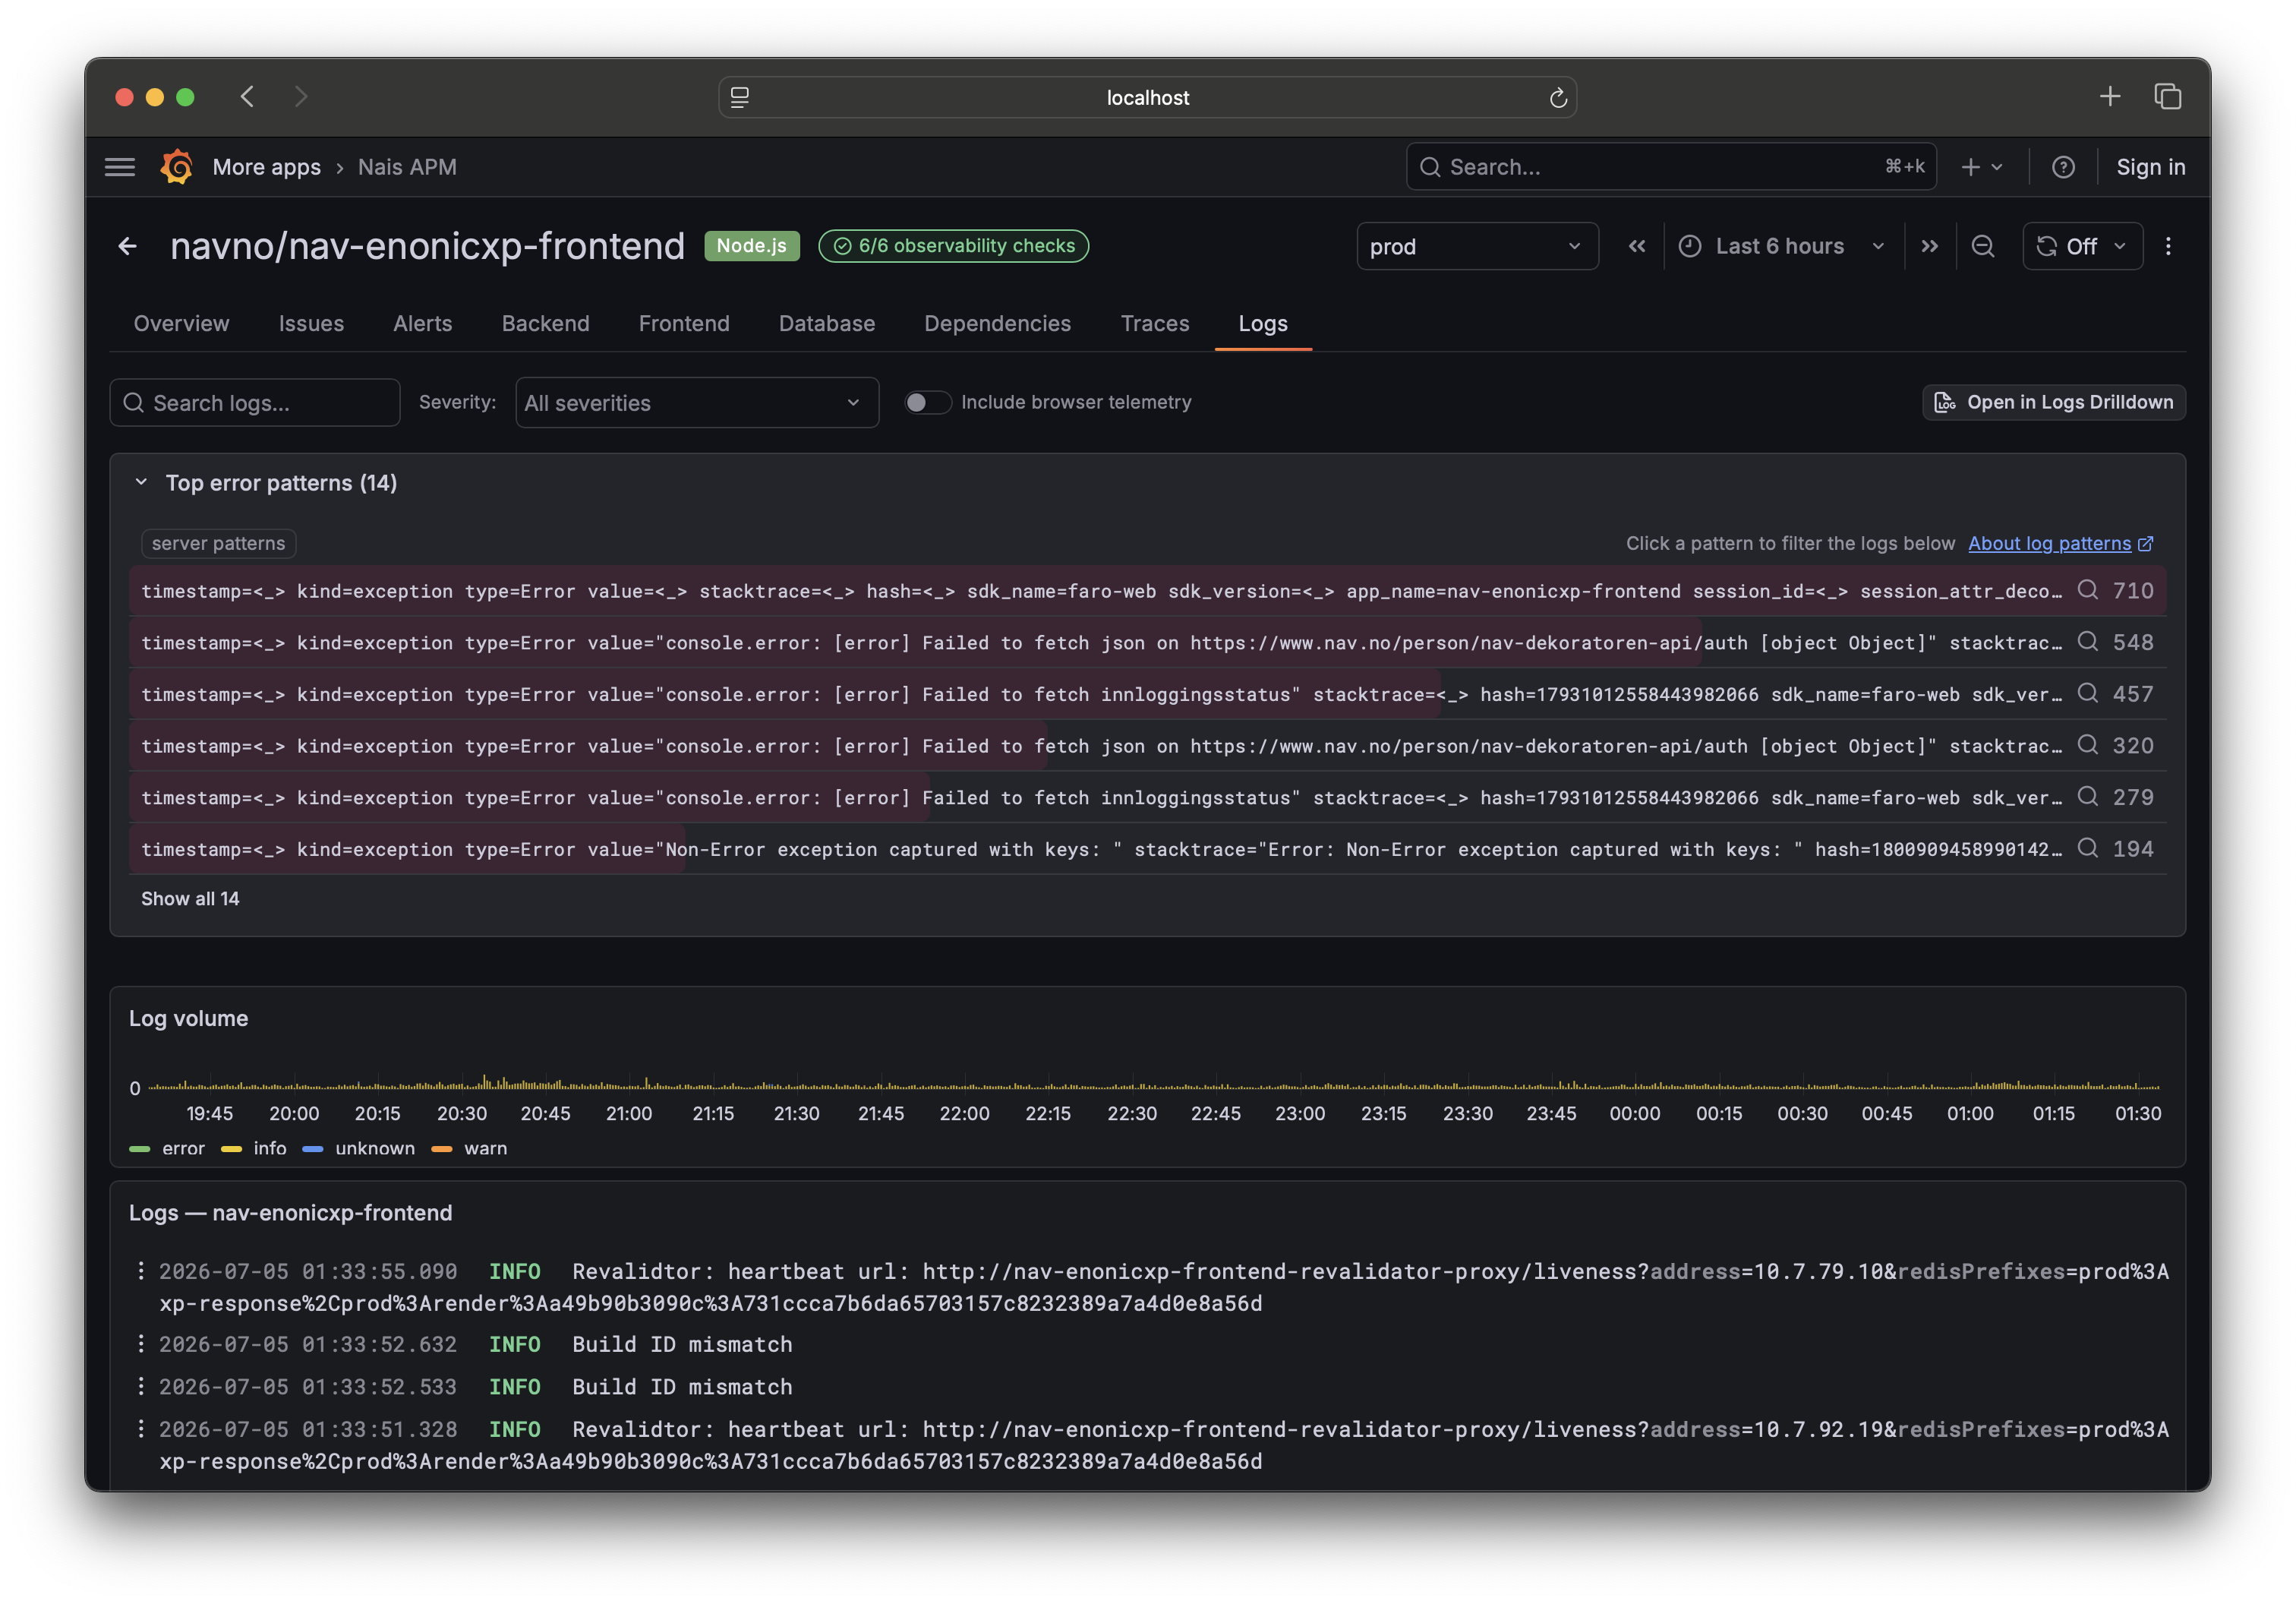
Open patterns 
Go to your service's Logs tab. The Patterns panel sits above the raw log stream and shows each detected pattern with its share of the volume, so the loudest patterns rise to the top.
Find what's new or spiking 
The point during an incident is to find the pattern that shouldn't be there:
- Narrow the time picker to the window around the incident. Patterns recompute for that range.
- Scan the top patterns by volume. A new error pattern that just started dominating is usually the culprit.
- Click a pattern to filter the raw log stream down to lines matching it, then drill into individual entries.
Because the time picker is shared across the whole service page, the patterns you see line up with the same window as the health header, issues, and traces.
Where the patterns come from 
Nais APM uses Loki's server-side pattern detection where it's available, and falls back to sampling recent lines when it isn't. Either way you get grouped patterns without writing a LogQL query. If a service has no queryable logs, the panel is empty — patterns need Loki, like the Logs and Issues tabs.
Pair it with trace breakdowns 
For latency and error incidents on the request path, the Traces tab's breakdowns are the equivalent tool: they group latency and errors by attribute so you can see which route or tag explains the p99, the same way patterns show which log line explains the noise.